Yin Tengfei, Cook Dianne, Lawrence Michael
Genome Biol. 2012 Aug 31;13(8):R77. doi: 10.1186/gb-2012-13-8-r77.
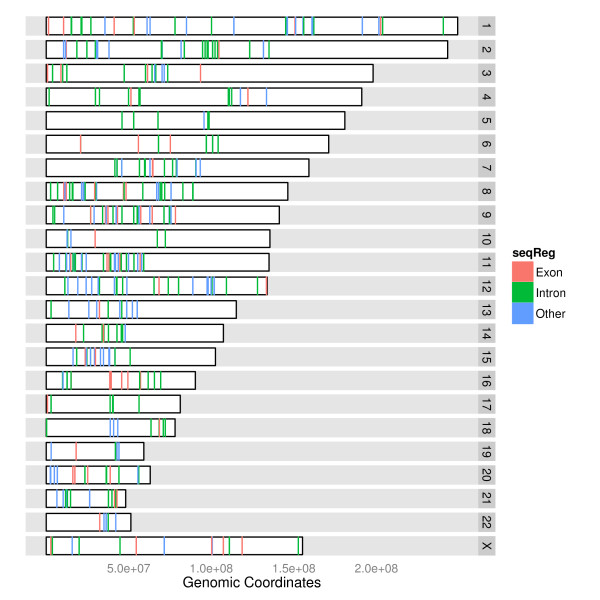
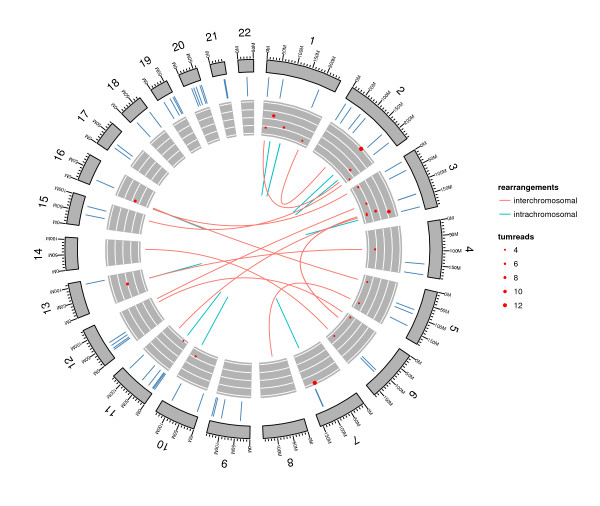
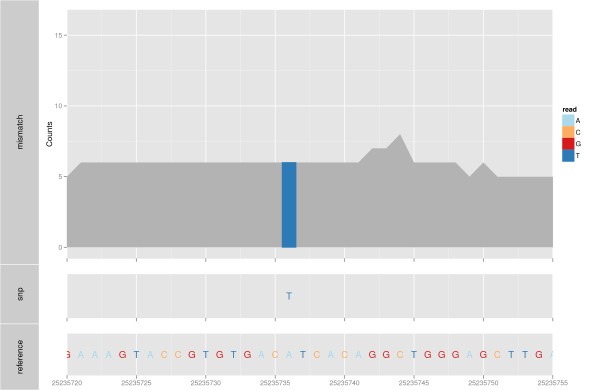
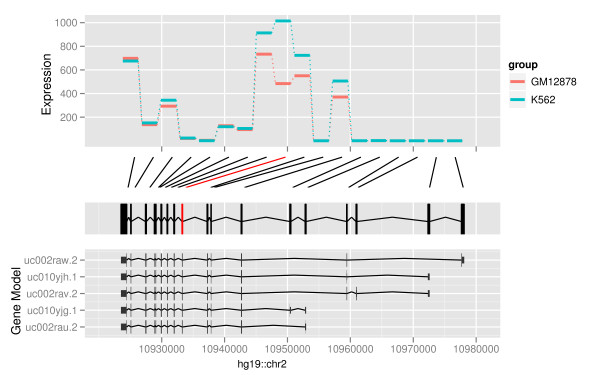
We introduce ggbio, a new methodology to visualize and explore genomics annotations and high-throughput data. The plots provide detailed views of genomic regions, summary views of sequence alignments and splicing patterns, and genome-wide overviews with karyogram, circular and grand linear layouts. The methods leverage the statistical functionality available in R, the grammar of graphics and the data handling capabilities of the Bioconductor project. The plots are specified within a modular framework that enables users to construct plots in a systematic way, and are generated directly from Bioconductor data structures. The ggbio R package is available at http://www.bioconductor.org/packages/2.11/bioc/html/ggbio.html.
我们引入了ggbio,这是一种用于可视化和探索基因组注释及高通量数据的新方法。这些图表提供了基因组区域的详细视图、序列比对和剪接模式的汇总视图,以及带有核型图、圆形和大型线性布局的全基因组概述。这些方法利用了R中可用的统计功能、图形语法以及Bioconductor项目的数据处理能力。图表在一个模块化框架中指定,该框架使用户能够以系统的方式构建图表,并直接从Bioconductor数据结构生成。ggbio R包可在http://www.bioconductor.org/packages/2.11/bioc/html/ggbio.html获取。