St. John's Cardiovascular Research Center, Los Angeles Biomedical Research Institute at Harbor-UCLA Medical Center, Division of Respiratory Physiology and Medicine, Department of Medicine, University of California at Los Angeles David Geffen School of Medicine Torrance, CA.
J Am Heart Assoc. 2012 Jun;1(3):e001883. doi: 10.1161/JAHA.112.001883. Epub 2012 Jun 22.
The complexity of cardiopulmonary exercise testing data and their displays tends to make assessment of patients, including those with heart failure, time consuming.
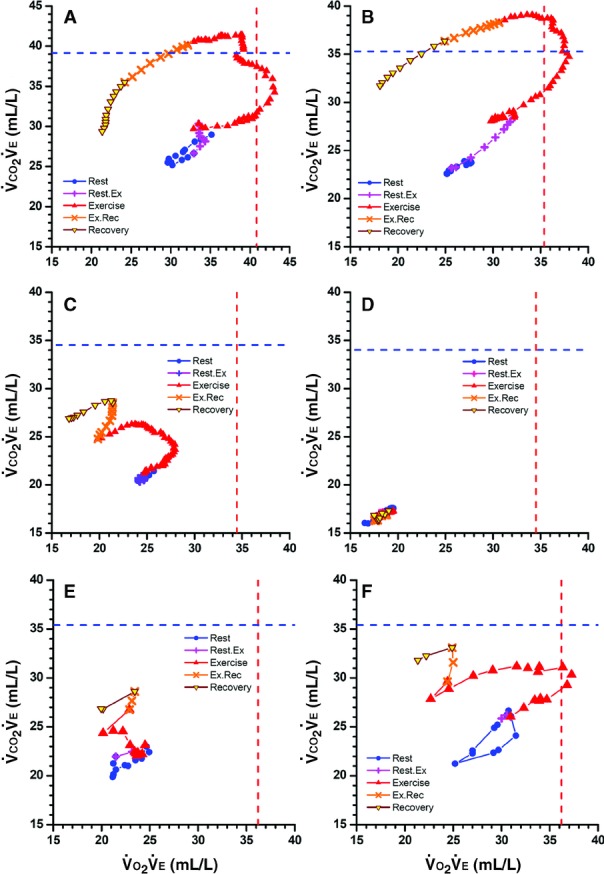
We postulated that a new single display that uses concurrent values of oxygen uptake / ventilation versus carbon dioxide output / ventilation ratios ([Formula: see text]-versus-[Formula: see text]), plotted on equal X-Y axes, would better quantify normality and heart failure severity and would clarify pathophysiology. Consecutive [Formula: see text]-versus-[Formula: see text] values from rest to recovery were displayed on X-Y axes for patients with Class II and IV heart failure and for healthy subjects without heart failure. The displays revealed distinctive patterns for each group, reflecting sequential changes in cardiac output, arterial and mixed venous O(2) and CO(2) content differences, and ventilation ([Formula: see text]). On the basis of exercise tests of 417 healthy subjects, reference formulas for highest [Formula: see text] and [Formula: see text], which normally occur during moderate exercise, are presented. Absolute and percent predicted values of highest [Formula: see text] and [Formula: see text] were recorded for 10 individuals from each group: Those of healthy subjects were significantly higher than those of patients with Class II heart failure, and those of patients with Class II heart failure were higher than those of patients with Class IV heart failure. These values differentiated heart failure severity better than peak [Formula: see text], anaerobic threshold, peak oxygen pulse, and [Formula: see text] slopes. Resting [Formula: see text]-versus-[Formula: see text] values were strikingly low for patients with Class IV heart failure, and with exercise, increased minimally or even decreased. With regard to the pathophysiology of heart failure, high [Formula: see text] values during milder exercise, previously attributed to ventilatory inefficiency, seem to be caused primarily by reduced cardiac output rather than increased [Formula: see text].
[Formula: see text]-versus-[Formula: see text] measurements and displays, extractable from future or existing exercise data, separate the 3 groups (healthy subjects, patients with Class II heart failure, and patients with Class IV heart failure) well and confirm the dominant role of low cardiac output rather than excessive [Formula: see text] in heart failure pathophysiology. (J Am Heart Assoc. 2012;1:e001883 doi: 10.1161/JAHA.112.001883.).
心肺运动测试数据及其显示的复杂性往往使患者的评估变得耗时,包括心力衰竭患者。
我们假设,一种新的单一显示,使用同时的摄氧量/通气与二氧化碳排出量/通气的比值([Formula: see text]-与-[Formula: see text]),绘制在相等的 X-Y 轴上,将更好地量化正常和心力衰竭的严重程度,并阐明病理生理学。连续的[Formula: see text]-与-[Formula: see text]值从休息到恢复,在 X-Y 轴上显示为 II 级和 IV 级心力衰竭患者和无心力衰竭的健康受试者。这些显示反映了每个组的独特模式,反映了心输出量、动脉和混合静脉 O(2)和 CO(2)含量差异以及通气([Formula: see text])的顺序变化。基于 417 名健康受试者的运动试验,提出了正常情况下发生在中度运动期间的最高[Formula: see text]和[Formula: see text]的参考公式。记录了每组 10 名个体的最高[Formula: see text]和[Formula: see text]的绝对值和百分比预测值:健康受试者的这些值明显高于 II 级心力衰竭患者,II 级心力衰竭患者的这些值高于 IV 级心力衰竭患者。这些值比峰值[Formula: see text]、无氧阈、峰值氧脉冲和[Formula: see text]斜率更好地区分心力衰竭的严重程度。IV 级心力衰竭患者的静息[Formula: see text]-与-[Formula: see text]值显著降低,运动时仅轻微增加甚至降低。关于心力衰竭的病理生理学,以前归因于通气效率低下的轻度运动中较高的[Formula: see text]值,似乎主要是由心输出量降低而不是[Formula: see text]增加引起的。
[Formula: see text]-与-[Formula: see text]的测量和显示,可以从未来或现有的运动数据中提取,将 3 组(健康受试者、II 级心力衰竭患者和 IV 级心力衰竭患者)很好地分开,并证实低心输出量而不是心力衰竭病理生理学中的过度[Formula: see text]占主导地位。(J Am Heart Assoc. 2012;1:e001883 .doi: 10.1161/JAHA.112.001883.)。