• 文献检索
  • 文档翻译
  • 深度研究
  • 学术资讯
  • Suppr Zotero 插件Zotero 插件
  • 邀请有礼
  • 套餐&价格
  • 历史记录
应用&插件
Suppr Zotero 插件Zotero 插件浏览器插件Mac 客户端Windows 客户端微信小程序
定价
高级版会员购买积分包购买API积分包
服务
文献检索文档翻译深度研究API 文档MCP 服务
关于我们
关于 Suppr公司介绍联系我们用户协议隐私条款
关注我们

Suppr 超能文献

核心技术专利:CN118964589B侵权必究
粤ICP备2023148730 号-1Suppr @ 2026

文献检索

告别复杂PubMed语法,用中文像聊天一样搜索,搜遍4000万医学文献。AI智能推荐,让科研检索更轻松。

立即免费搜索

文件翻译

保留排版,准确专业,支持PDF/Word/PPT等文件格式,支持 12+语言互译。

免费翻译文档

深度研究

AI帮你快速写综述,25分钟生成高质量综述,智能提取关键信息,辅助科研写作。

立即免费体验

美国儿童和成人的食物和饮料中钠的摄入量按来源地和特定食物来源划分。

Sodium intakes of US children and adults from foods and beverages by location of origin and by specific food source.

机构信息

Université Pierre et Marie Curie-Paris VI, Groupe Hospitalier Pitié-Salpêtrière, 91 boulevard de l'Hôpital, Paris 75013, France.

出版信息

Nutrients. 2013 May 28;5(6):1840-55. doi: 10.3390/nu5061840.

DOI:10.3390/nu5061840
PMID:23760055
原文链接:https://pmc.ncbi.nlm.nih.gov/articles/PMC3725480/
Abstract

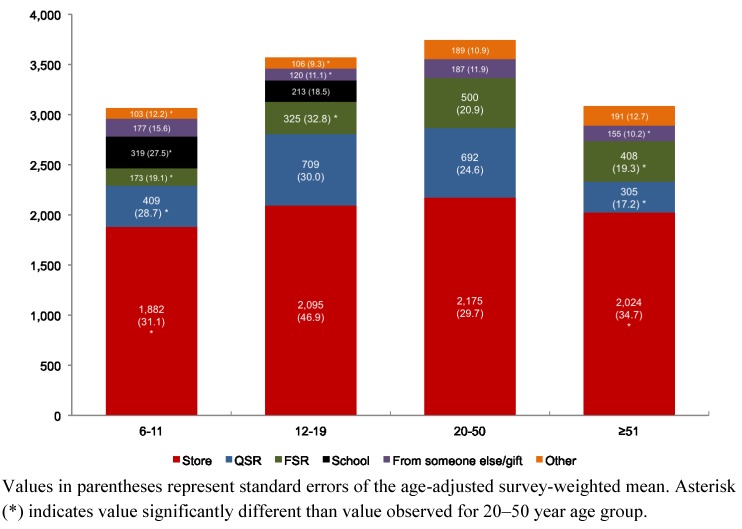
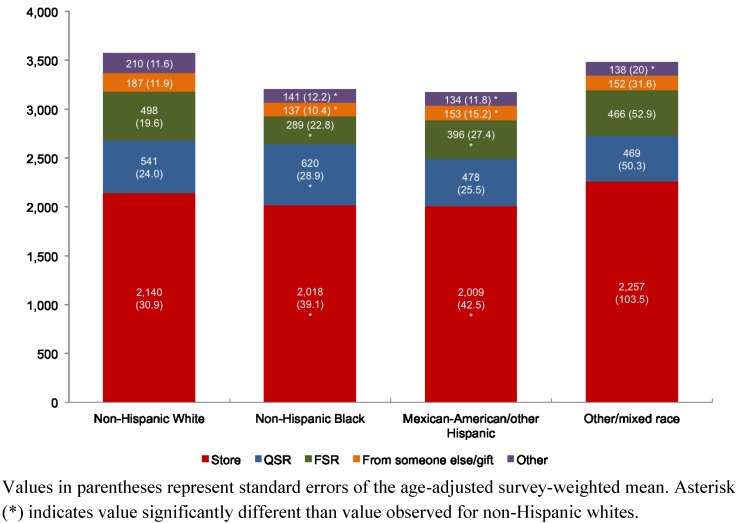
Sodium intakes, from foods and beverages, of 22,852 persons in the National Health and Nutrition Examination Surveys (NHANES 2003-2008) were examined by specific food source and by food location of origin. Analyses were based on a single 24-h recall. Separate analyses were conducted for children (6-11 years of age), adolescents (12-19), and adults (20-50 and ≥51 years). Grouping of like foods (e.g., food sources) used a scheme proposed by the National Cancer Institute, which divides foods/beverages into 96 food subgroups (e.g., pizza, yeast breads or cold cuts). Food locations of origin were stores (e.g., grocery, convenience and specialty stores), quick-service restaurant/pizza (QSR), full-service restaurant (FSR), school, or other. Food locations of sodium were also evaluated by race/ethnicity amongst adults. Stores provided between 58.1% and 65.2% of dietary sodium, whereas QSR and FSR together provided between 18.9% and 31.8% depending on age. The proportion of sodium from QSR varied from 10.1% to 19.9%, whereas that from FSR varied from 3.4% to 13.3%. School meals provided 10.4% of sodium for 6-11 year olds and 6.0% for 12-19 year olds. Pizza from QSR, the top away from home food item, provided 5.4% of sodium in adolescents. QSR pizza, chicken, burgers and Mexican dishes combined provided 7.8% of total sodium in adult diets. Most sodium came from foods purchased in stores. Food manufacturers, restaurants, and grocery stores all have a role to play in reducing the amount of sodium in the American diet.

摘要

通过特定的食物来源和食物产地,对 22852 名参加国家健康和营养检查调查(NHANES 2003-2008)的人的钠摄入量进行了检查。分析基于单一的 24 小时回忆。分别对儿童(6-11 岁)、青少年(12-19 岁)和成年人(20-50 岁和≥51 岁)进行了分析。相似食物(如食物来源)的分组使用了美国国家癌症研究所提出的方案,该方案将食物/饮料分为 96 个食物亚组(如披萨、酵母面包或冷切)。食物产地为商店(如杂货店、便利店和专卖店)、快餐/披萨(QSR)、全方位服务餐厅(FSR)、学校或其他。在成年人中,还根据种族/族裔评估了食物中钠的来源。商店提供的钠占饮食中钠的 58.1%-65.2%,而 QSR 和 FSR 提供的钠分别占 18.9%-31.8%,具体取决于年龄。QSR 提供的钠比例从 10.1%到 19.9%不等,而 FSR 提供的钠比例从 3.4%到 13.3%不等。学校餐为 6-11 岁的儿童提供 10.4%的钠,为 12-19 岁的儿童提供 6.0%的钠。QSR 披萨是最受欢迎的外出就餐食品,为青少年提供 5.4%的钠。QSR 披萨、鸡肉、汉堡和墨西哥菜的总和为成人饮食提供了 7.8%的总钠。大多数钠来自商店购买的食物。食品制造商、餐馆和杂货店都可以在减少美国家庭饮食中的钠含量方面发挥作用。

https://cdn.ncbi.nlm.nih.gov/pmc/blobs/6fb0/3725480/9dd2f2432688/nutrients-05-01840-g002.jpg
https://cdn.ncbi.nlm.nih.gov/pmc/blobs/6fb0/3725480/e942af62a6c5/nutrients-05-01840-g001.jpg
https://cdn.ncbi.nlm.nih.gov/pmc/blobs/6fb0/3725480/9dd2f2432688/nutrients-05-01840-g002.jpg
https://cdn.ncbi.nlm.nih.gov/pmc/blobs/6fb0/3725480/e942af62a6c5/nutrients-05-01840-g001.jpg
https://cdn.ncbi.nlm.nih.gov/pmc/blobs/6fb0/3725480/9dd2f2432688/nutrients-05-01840-g002.jpg

相似文献

1
Sodium intakes of US children and adults from foods and beverages by location of origin and by specific food source.美国儿童和成人的食物和饮料中钠的摄入量按来源地和特定食物来源划分。
Nutrients. 2013 May 28;5(6):1840-55. doi: 10.3390/nu5061840.
2
Energy intakes of US children and adults by food purchase location and by specific food source.美国儿童和成人的食物购买地点和特定食物来源的能量摄入量。
Nutr J. 2013 May 8;12:59. doi: 10.1186/1475-2891-12-59.
3
Sodium Intake among US School-Aged Children: National Health and Nutrition Examination Survey, 2011-2012.美国学龄儿童的钠摄入量:2011 - 2012年国家健康与营养检查调查
J Acad Nutr Diet. 2017 Jan;117(1):39-47.e5. doi: 10.1016/j.jand.2016.09.010. Epub 2016 Nov 3.
4
A new method to monitor the contribution of fast food restaurants to the diets of US children.一种监测快餐店对美国儿童饮食贡献的新方法。
PLoS One. 2014 Jul 25;9(7):e103543. doi: 10.1371/journal.pone.0103543. eCollection 2014.
5
Trends in Consumption of Solid Fats, Added Sugars, Sodium, Sugar-Sweetened Beverages, and Fruit from Fast Food Restaurants and by Fast Food Restaurant Type among US Children, 2003-2010.2003 - 2010年美国儿童从快餐店摄入的固体脂肪、添加糖、钠、含糖饮料及水果的消费趋势,以及按快餐店类型划分的消费趋势
Nutrients. 2016 Dec 13;8(12):804. doi: 10.3390/nu8120804.
6
Consumption of sugar-sweetened beverages and discretionary foods among US adults by purchase location.美国成年人按购买地点划分的含糖饮料和自由支配食品的消费情况。
Eur J Clin Nutr. 2016 Dec;70(12):1396-1400. doi: 10.1038/ejcn.2016.136. Epub 2016 Aug 10.
7
Vital signs: sodium intake among U.S. school-aged children - 2009-2010.生命体征:美国学龄儿童的钠摄入量-2009-2010 年。
MMWR Morb Mortal Wkly Rep. 2014 Sep 12;63(36):789-97.
8
Consumption of added sugars among US children and adults by food purchase location and food source.按食品购买地点和食物来源统计的美国儿童及成人添加糖消费量
Am J Clin Nutr. 2014 Sep;100(3):901-7. doi: 10.3945/ajcn.114.089458. Epub 2014 Jul 16.
9
Top food sources of percentage of energy, nutrients to limit and total gram amount consumed among US adolescents: National Health and Nutrition Examination Survey 2011-2014.美国青少年能量百分比、限制营养素和总克数摄入量最高的食物来源:2011-2014 年全国健康和营养调查。
Public Health Nutr. 2019 Mar;22(4):661-671. doi: 10.1017/S1368980018002884. Epub 2018 Nov 23.
10
Fast-food and full-service restaurant consumption and daily energy and nutrient intakes in US adults.美国成年人的快餐及全方位服务餐厅消费情况与每日能量和营养摄入量
Eur J Clin Nutr. 2016 Jan;70(1):97-103. doi: 10.1038/ejcn.2015.104. Epub 2015 Jul 1.

引用本文的文献

1
Improved Diet Quality in Elite and Entry-Level Military Women Compared With Civilian-Matched Counterparts.与平民对照者相比,精英和初级军事女性的饮食质量有所改善。
Curr Dev Nutr. 2024 Nov 29;9(1):104517. doi: 10.1016/j.cdnut.2024.104517. eCollection 2025 Jan.
2
Sodium Content and Sodium Intake Contributions of Store-Bought and Restaurant-Prepared Foods in Their As-Eaten Form: National Health and Nutrition Examination Survey, 2009-2018.市售食品和餐厅烹制食品以即食形式呈现时的钠含量及钠摄入量贡献:2009 - 2018年美国国家健康与营养检查调查
Curr Dev Nutr. 2024 Sep 2;8(10):104455. doi: 10.1016/j.cdnut.2024.104455. eCollection 2024 Oct.
3

本文引用的文献

1
Fast-food and full-service restaurant consumption among children and adolescents: effect on energy, beverage, and nutrient intake.儿童和青少年食用快餐和正餐的情况:对能量、饮料和营养素摄入的影响。
JAMA Pediatr. 2013 Jan;167(1):14-20. doi: 10.1001/jamapediatrics.2013.417.
2
Foods contributing to sodium intake and urinary sodium excretion in a group of Australian women.一组澳大利亚女性饮食中钠的摄入量和尿钠排泄量。
Public Health Nutr. 2013 Oct;16(10):1837-42. doi: 10.1017/S1368980012004016. Epub 2012 Aug 31.
3
Sodium and potassium intakes among US adults: NHANES 2003-2008.
Determination of factors associated with serum cholesterol response to dairy fat consumption in overweight adults: Secondary analysis from an RCT.
超重成年人血清胆固醇对食用乳脂肪反应的相关因素测定:一项随机对照试验的二次分析
Front Nutr. 2022 Aug 3;9:945723. doi: 10.3389/fnut.2022.945723. eCollection 2022.
4
Low dietary sodium potentially mediates COVID-19 prevention associated with whole-food plant-based diets.低膳食钠可能介导与全食物植物性饮食相关的新冠病毒预防作用。
Br J Nutr. 2023 Apr 14;129(7):1136-1141. doi: 10.1017/S0007114522002252. Epub 2022 Aug 1.
5
Sodium content of restaurant dishes in China: a cross-sectional survey.中国餐馆菜品的钠含量:一项横断面调查。
Nutr J. 2022 Feb 17;21(1):10. doi: 10.1186/s12937-022-00762-4.
6
Greater Scores for Dietary Fat and Grain Quality Components Underlie Higher Total Healthy Eating Index-2015 Scores, While Whole Fruits, Seafood, and Plant Proteins Are Most Favorably Associated with Cardiometabolic Health in US Adults.膳食脂肪和谷物质量成分得分更高是2015年健康饮食指数总分更高的基础,而在美国成年人中,完整水果、海鲜和植物蛋白与心血管代谢健康的关联最为有利。
Curr Dev Nutr. 2021 Feb 26;5(3):nzab015. doi: 10.1093/cdn/nzab015. eCollection 2021 Mar.
7
A Lower Sodium Neapolitan Pizza Prepared with Seawater in Place of Salt: Nutritional Properties, Sensory Characteristics, and Metabolic Effects.用海水代替盐制作的低钠那不勒斯披萨:营养特性、感官特征和代谢影响。
Nutrients. 2020 Nov 17;12(11):3533. doi: 10.3390/nu12113533.
8
Coffee Consumption among Adults in the United States by Demographic Variables and Purchase Location: Analyses of NHANES 2011-2016 Data.美国成年人按人口变量和购买地点的咖啡消费情况:NHANES 2011-2016 年数据分析。
Nutrients. 2020 Aug 16;12(8):2463. doi: 10.3390/nu12082463.
9
Sodium and salt content of Portuguese rolls produced in a city of southern Brazil: a comparison of laboratory analysis, food labelling and nutrition standards.巴西南部一城市生产的葡萄牙卷的钠和盐含量:实验室分析、食品标签和营养标准的比较。
Public Health Nutr. 2021 Jun;24(8):2337-2344. doi: 10.1017/S1368980020000786. Epub 2020 Jun 17.
10
Dietary Sodium Intake and Food Sources Among Chinese Adults: Data from the CNNHS 2010-2012.中国成年人的膳食钠摄入量和食物来源:CNNHS2010-2012 数据。
Nutrients. 2020 Feb 11;12(2):453. doi: 10.3390/nu12020453.
美国成年人的钠和钾摄入量:NHANES 2003-2008。
Am J Clin Nutr. 2012 Sep;96(3):647-57. doi: 10.3945/ajcn.112.034413. Epub 2012 Aug 1.
4
Reducing the sodium-potassium ratio in the US diet: a challenge for public health.降低美国饮食中的钠钾比:公共卫生面临的挑战。
Am J Clin Nutr. 2012 Aug;96(2):439-44. doi: 10.3945/ajcn.111.025353. Epub 2012 Jul 3.
5
Vital signs: food categories contributing the most to sodium consumption - United States, 2007-2008.生命体征:2007-2008 年美国导致钠摄入量最高的食物种类。
MMWR Morb Mortal Wkly Rep. 2012 Feb 10;61(5):92-8.
6
Usual sodium intakes compared with current dietary guidelines --- United States, 2005-2008.与现行饮食指南相比的通常钠摄入量 --- 美国,2005-2008 年。
MMWR Morb Mortal Wkly Rep. 2011 Oct 21;60(41):1413-7.
7
Reducing salt intake in the Americas: Pan American Health Organization actions.减少美洲地区的盐摄入量:泛美卫生组织的行动。
J Health Commun. 2011 Aug;16 Suppl 2:37-48. doi: 10.1080/10810730.2011.601227.
8
Sodium content of processed foods in the United Kingdom: analysis of 44,000 foods purchased by 21,000 households.英国加工食品中的钠含量:对 21000 户家庭购买的 44000 种食品的分析。
Am J Clin Nutr. 2011 Mar;93(3):594-600. doi: 10.3945/ajcn.110.004481. Epub 2010 Dec 29.
9
Sources of sodium in Australian children's diets and the effect of the application of sodium targets to food products to reduce sodium intake.澳大利亚儿童饮食中的钠来源,以及应用钠目标对食品进行限制以减少钠摄入量的效果。
Br J Nutr. 2011 Feb;105(3):468-77. doi: 10.1017/S0007114510003673. Epub 2010 Sep 28.
10
Sodium intake among adults - United States, 2005-2006.成年人的钠摄入量——美国,2005-2006 年。
MMWR Morb Mortal Wkly Rep. 2010 Jun 25;59(24):746-9.