Leibniz-Institute for Arteriosclerosis Research at the University Muenster, Muenster, Germany.
PLoS One. 2013 Aug 19;8(8):e71775. doi: 10.1371/journal.pone.0071775. eCollection 2013.
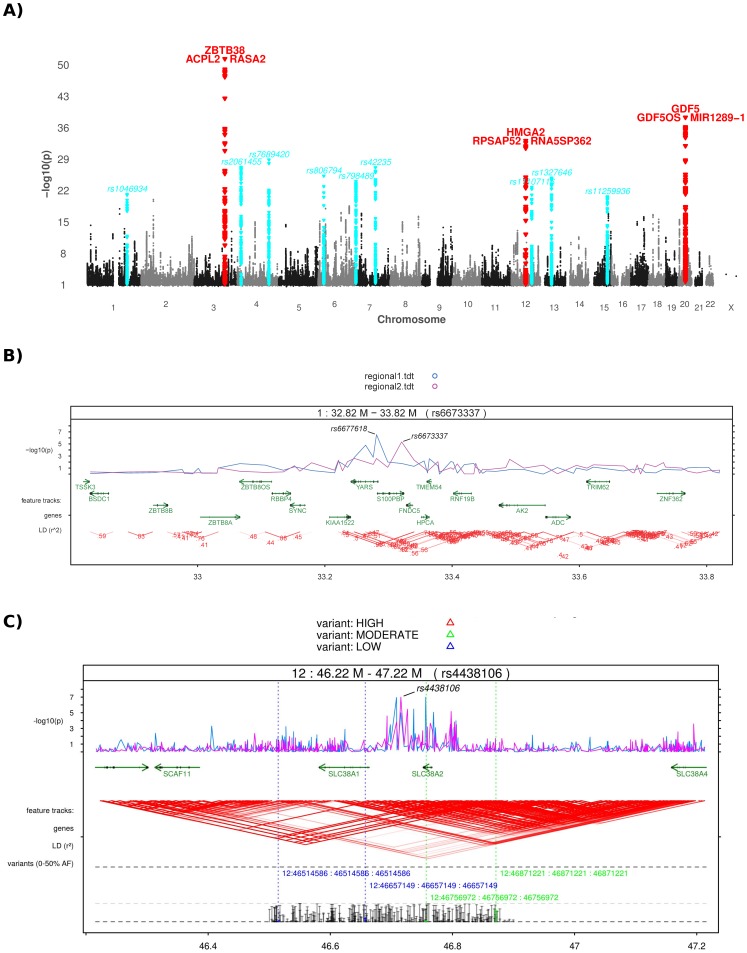
We present a comprehensive toolkit for post-processing, visualization and advanced analysis of GWAS results. In the spirit of comparable tools for gene-expression analysis, we attempt to unify and simplify several procedures that are essential for the interpretation of GWAS results. This includes the generation of advanced Manhattan and regional association plots including rare variant display as well as novel interaction network analysis tools for the investigation of systems-biology aspects. Our package supports virtually all model organisms and represents the first cohesive implementation of such tools for the popular language R. Previous software of that range is dispersed over a wide range of platforms and mostly not adaptable for custom work pipelines. We demonstrate the utility of this package by providing an example workflow on a publicly available dataset.
我们提供了一个全面的工具包,用于 GWAS 结果的后处理、可视化和高级分析。本着与基因表达分析工具可比的精神,我们试图统一和简化解释 GWAS 结果所必需的几个步骤。这包括生成高级曼哈顿和区域关联图,包括罕见变异显示,以及用于研究系统生物学方面的新的交互网络分析工具。我们的软件包几乎支持所有的模式生物,并且是首次在流行的 R 语言中实现此类工具的统一实现。此类范围的先前软件分散在许多平台上,并且大多不能适应定制工作流程。我们通过在公开可用的数据集上提供示例工作流程来证明该软件包的实用性。