Life Sciences Division, Lawrence Berkeley National Laboratory, Berkeley, California, United States of America.
PLoS One. 2013 Nov 29;8(11):e78777. doi: 10.1371/journal.pone.0078777. eCollection 2013.
To assess the dose-response relationships between cause-specific mortality and exercise energy expenditure in a prospective epidemiological cohort of walkers.
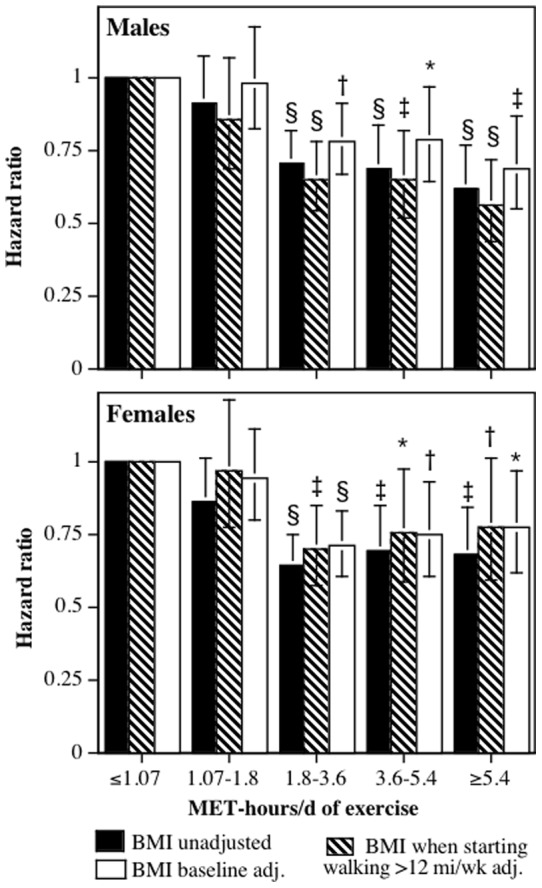
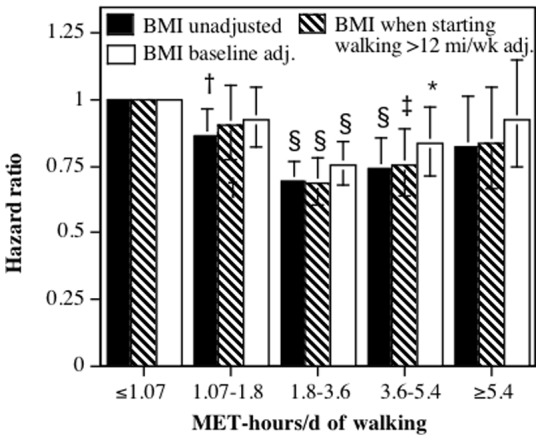
The sample consisted of the 8,436 male and 33,586 female participants of the National Walkers' Health Study. Walking energy expenditure was calculated in metabolic equivalents (METs, 1 MET = 3.5 ml O2/kg/min), which were used to divide the cohort into four exercise categories: category 1 (≤ 1.07 MET-hours/d), category 2 (1.07 to 1.8 MET-hours/d), category 3 (1.8 to 3.6 MET-hours/d), and category 4 (≥ 3.6 MET-hours/d). Competing risk regression analyses were use to calculate the risk of mortality for categories 2, 3 and 4 relative to category 1.
22.9% of the subjects were in category 1, 16.1% in category 2, 33.3% in category 3, and 27.7% in category 4. There were 2,448 deaths during the 9.6 average years of follow-up. Total mortality was 11.2% lower in category 2 (P = 0.04), 32.4% lower in category 3 (P<10(-12)) and 32.9% lower in category 4 (P = 10(-11)) than in category 1. For underlying causes of death, the respective risk reductions for categories 2, 3 and 4 were 23.6% (P = 0.008), 35.2% (P<10(-5)), and 34.9% (P = 0.0001) for cardiovascular disease mortality; 27.8% (P = 0.18), 20.6% (P = 0.07), and 31.4% (P = 0.009) for ischemic heart disease mortality; and 39.4% (P = 0.18), 63.8% (P = 0.005), and 90.6% (P = 0.002) for diabetes mortality when compared to category 1. For all related mortality (i.e., underlying and contributing causes of death combined), the respective risk reductions for categories 2, 3 and 4 were 18.7% (P = 0.22), 42.5% (P = 0.001), and 57.5% (P = 0.0001) for heart failure; 9.4% (P = 0.56), 44.3% (P = 0.0004), and 33.5% (P = 0.02) for hypertensive diseases; 11.5% (P = 0.38), 41.0% (P<10(-4)), and 35.5% (P = 0.001) for dysrhythmias: and 23.2% (P = 0.13), 45.8% (P = 0.0002), and 41.1% (P = 0.005) for cerebrovascular diseases when compared to category 1.
There are substantial health benefits to exceeding the current exercise guidelines.
在一项前瞻性的步行者流行病学队列研究中,评估特定原因死亡率与运动能量消耗之间的剂量反应关系。
该样本包括国家步行者健康研究中的 8436 名男性和 33586 名女性参与者。步行能量消耗以代谢当量(MET,1 MET = 3.5 ml O2/kg/min)计算,将队列分为四个运动类别:第 1 类(≤ 1.07 MET-hours/d),第 2 类(1.07 至 1.8 MET-hours/d),第 3 类(1.8 至 3.6 MET-hours/d)和第 4 类(≥ 3.6 MET-hours/d)。使用竞争风险回归分析计算第 2、3 和 4 类相对于第 1 类的死亡率风险。
22.9%的受试者属于第 1 类,16.1%属于第 2 类,33.3%属于第 3 类,27.7%属于第 4 类。在 9.6 年的平均随访期间,共有 2448 人死亡。与第 1 类相比,第 2 类(P=0.04)、第 3 类(P<10(-12)))和第 4 类(P=10(-11)))的总死亡率分别降低了 11.2%、32.4%和 32.9%。对于根本死因死亡率,第 2、3 和 4 类的相应风险降低分别为 23.6%(P=0.008)、35.2%(P<10(-5)))和 34.9%(P=0.0001)心血管疾病死亡率;27.8%(P=0.18)、20.6%(P=0.07)和 31.4%(P=0.009)缺血性心脏病死亡率;以及 39.4%(P=0.18)、63.8%(P=0.005)和 90.6%(P=0.002)糖尿病死亡率与第 1 类相比。对于所有相关死亡率(即根本原因和促成原因的死亡总和),第 2、3 和 4 类的相应风险降低分别为 18.7%(P=0.22)、42.5%(P=0.001)和 57.5%(P=0.0001)心力衰竭;9.4%(P=0.56)、44.3%(P=0.0004)和 33.5%(P=0.02)高血压疾病;11.5%(P=0.38)、41.0%(P<10(-4)))和 35.5%(P=0.001)心律失常;以及 23.2%(P=0.13)、45.8%(P=0.0002)和 41.1%(P=0.005)与第 1 类相比脑血管疾病。
超过当前运动指南有显著的健康益处。