Hu Ying, Yan Chunhua, Hsu Chih-Hao, Chen Qing-Rong, Niu Kelvin, Komatsoulis George A, Meerzaman Daoud
Center for Biomedical Informatics and Information Technology, National Cancer Institute, Rockville, MD 20850, USA.
Cancer Inform. 2014 Jan 16;13:13-20. doi: 10.4137/CIN.S13495. eCollection 2014.
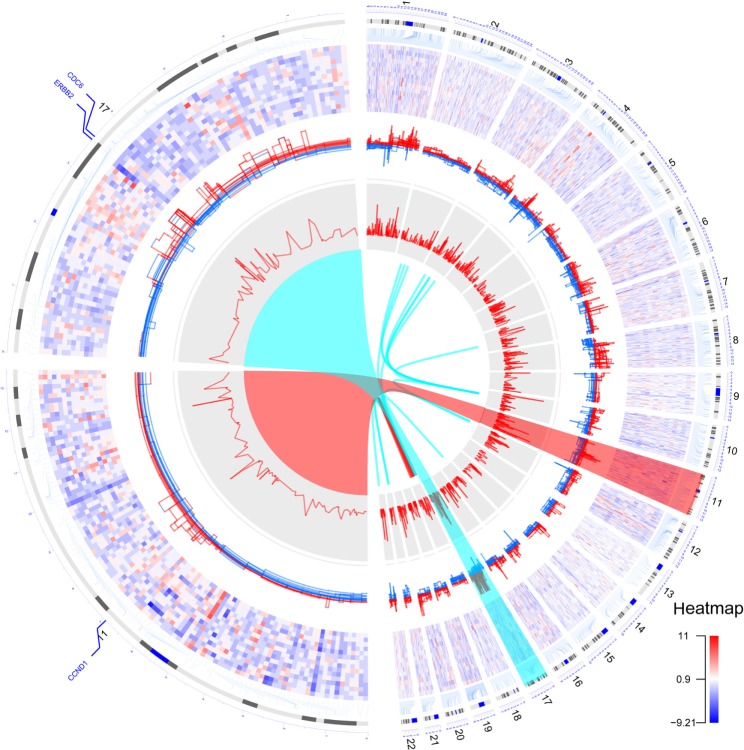
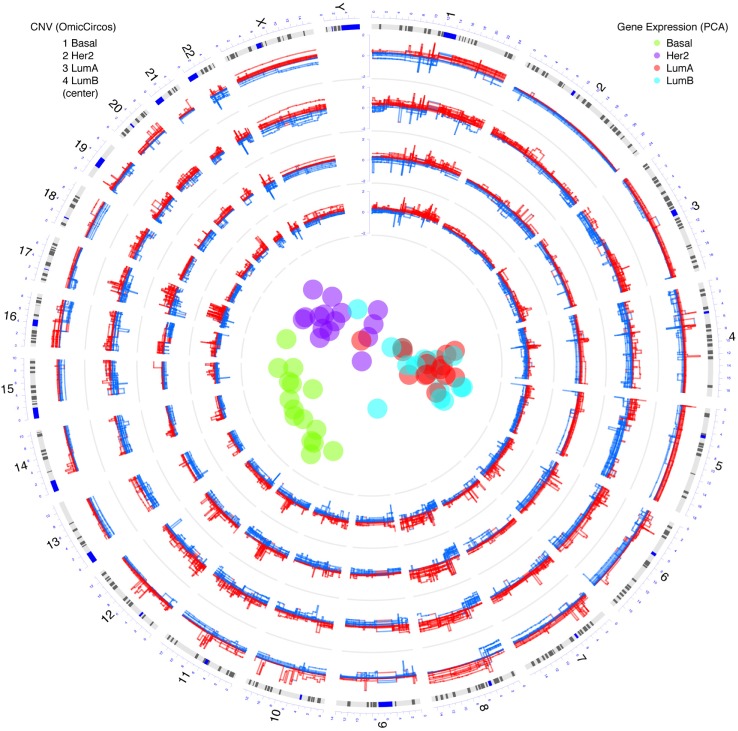
OmicCircos is an R software package used to generate high-quality circular plots for visualizing genomic variations, including mutation patterns, copy number variations (CNVs), expression patterns, and methylation patterns. Such variations can be displayed as scatterplot, line, or text-label figures. Relationships among genomic features in different chromosome positions can be represented in the forms of polygons or curves. Utilizing the statistical and graphic functions in an R/Bioconductor environment, OmicCircos performs statistical analyses and displays results using cluster, boxplot, histogram, and heatmap formats. In addition, OmicCircos offers a number of unique capabilities, including independent track drawing for easy modification and integration, zoom functions, link-polygons, and position-independent heatmaps supporting detailed visualization.
OmicCircos is available through Bioconductor at http://www.bioconductor.org/packages/devel/bioc/html/OmicCircos.html. An extensive vignette in the package describes installation, data formatting, and workflow procedures. The software is open source under the Artistic-2.0 license.
OmicCircos是一个R软件包,用于生成高质量的圆形图,以可视化基因组变异,包括突变模式、拷贝数变异(CNV)、表达模式和甲基化模式。此类变异可以显示为散点图、折线图或文本标签图。不同染色体位置的基因组特征之间的关系可以用多边形或曲线的形式表示。利用R/Bioconductor环境中的统计和图形功能,OmicCircos进行统计分析,并使用聚类、箱线图、直方图和热图格式显示结果。此外,OmicCircos还提供了许多独特的功能,包括便于修改和整合的独立轨迹绘制、缩放功能、链接多边形以及支持详细可视化的位置无关热图。
可通过Bioconductor在http://www.bioconductor.org/packages/devel/bioc/html/OmicCircos.html获取OmicCircos。该软件包中的详细 vignette 描述了安装、数据格式化和工作流程。该软件在Artistic-2.0许可下开源。