Louis Valérie R, Phalkey Revati, Horstick Olaf, Ratanawong Pitcha, Wilder-Smith Annelies, Tozan Yesim, Dambach Peter
Institute of Public Health, Heidelberg University Medical School, Heidelberg, Germany.
Int J Health Geogr. 2014 Dec 9;13:50. doi: 10.1186/1476-072X-13-50.
The global spread and the increased frequency and magnitude of epidemic dengue in the last 50 years underscore the urgent need for effective tools for surveillance, prevention, and control. This review aims at providing a systematic overview of what predictors are critical and which spatial and spatio-temporal modeling approaches are useful in generating risk maps for dengue.
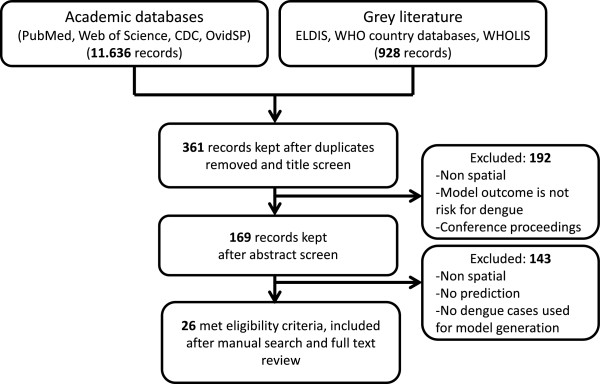
A systematic search was undertaken, using the PubMed, Web of Science, WHOLIS, Centers for Disease Control and Prevention (CDC) and OvidSP databases for published citations, without language or time restrictions. A manual search of the titles and abstracts was carried out using predefined criteria, notably the inclusion of dengue cases. Data were extracted for pre-identified variables, including the type of predictors and the type of modeling approach used for risk mapping.
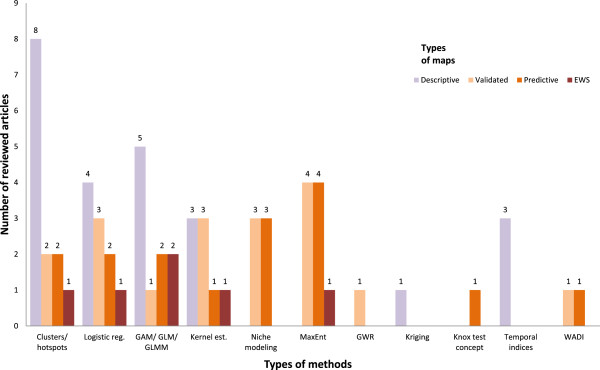
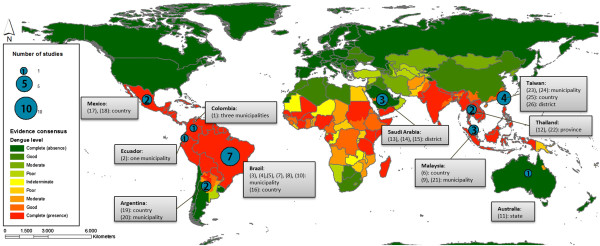
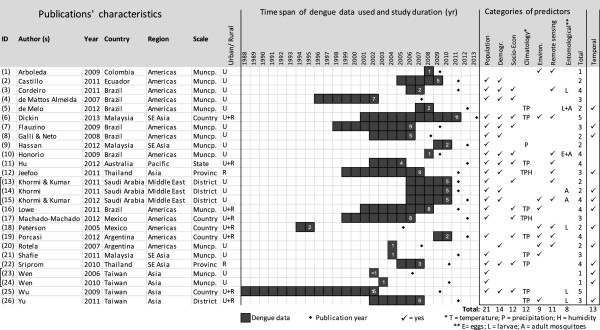
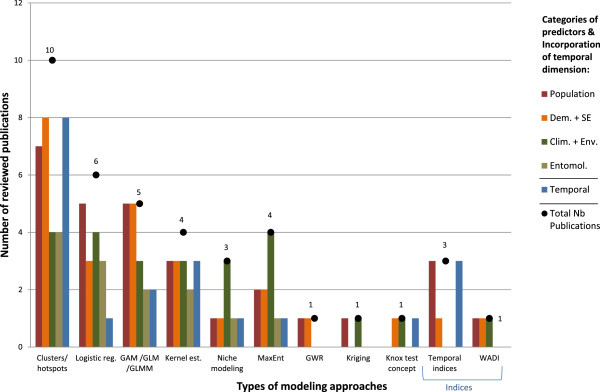
A wide variety of both predictors and modeling approaches was used to create dengue risk maps. No specific patterns could be identified in the combination of predictors or models across studies. The most important and commonly used predictors for the category of demographic and socio-economic variables were age, gender, education, housing conditions and level of income. Among environmental variables, precipitation and air temperature were often significant predictors. Remote sensing provided a source of varied land cover data that could act as a proxy for other predictor categories. Descriptive maps showing dengue case hotspots were useful for identifying high-risk areas. Predictive maps based on more complex methodology facilitated advanced data analysis and visualization, but their applicability in public health contexts remains to be established.
The majority of available dengue risk maps was descriptive and based on retrospective data. Availability of resources, feasibility of acquisition, quality of data, alongside available technical expertise, determines the accuracy of dengue risk maps and their applicability to the field of public health. A large number of unknowns, including effective entomological predictors, genetic diversity of circulating viruses, population serological profile, and human mobility, continue to pose challenges and to limit the ability to produce accurate and effective risk maps, and fail to support the development of early warning systems.
过去50年里,登革热在全球范围内的传播以及其流行频率和规模的增加凸显了对有效监测、预防和控制工具的迫切需求。本综述旨在系统概述哪些预测因素至关重要,以及哪些空间和时空建模方法有助于生成登革热风险地图。
利用PubMed、科学网、世界卫生组织图书馆信息系统(WHOLIS)、疾病控制和预防中心(CDC)以及OvidSP数据库进行系统检索,以获取已发表的文献引用,无语言或时间限制。使用预定义标准对手稿标题和摘要进行人工检索,特别是纳入登革热病例。提取预先确定变量的数据,包括预测因素类型和用于风险绘图的建模方法类型。
多种预测因素和建模方法被用于创建登革热风险地图。在各项研究中,预测因素或模型的组合未发现特定模式。在人口统计学和社会经济变量类别中,最重要且最常用的预测因素是年龄、性别、教育程度、住房条件和收入水平。在环境变量中,降水和气温通常是重要的预测因素。遥感提供了多种土地覆盖数据来源,可作为其他预测因素类别的替代指标。显示登革热病例热点的描述性地图有助于识别高风险区域。基于更复杂方法的预测性地图便于进行高级数据分析和可视化,但其在公共卫生背景下的适用性仍有待确定。
大多数现有的登革热风险地图是描述性的,且基于回顾性数据。资源的可用性、获取的可行性、数据质量以及现有的技术专长决定了登革热风险地图的准确性及其在公共卫生领域的适用性。大量未知因素,包括有效的昆虫学预测因素、传播病毒的遗传多样性、人群血清学特征以及人口流动性,继续构成挑战并限制生成准确有效风险地图的能力,且无法支持预警系统的开发。