• 文献检索
  • 文档翻译
  • 深度研究
  • 学术资讯
  • Suppr Zotero 插件Zotero 插件
  • 邀请有礼
  • 套餐&价格
  • 历史记录
应用&插件
Suppr Zotero 插件Zotero 插件浏览器插件Mac 客户端Windows 客户端微信小程序
定价
高级版会员购买积分包购买API积分包
服务
文献检索文档翻译深度研究API 文档MCP 服务
关于我们
关于 Suppr公司介绍联系我们用户协议隐私条款
关注我们

Suppr 超能文献

核心技术专利:CN118964589B侵权必究
粤ICP备2023148730 号-1Suppr @ 2026

文献检索

告别复杂PubMed语法,用中文像聊天一样搜索,搜遍4000万医学文献。AI智能推荐,让科研检索更轻松。

立即免费搜索

文件翻译

保留排版,准确专业,支持PDF/Word/PPT等文件格式,支持 12+语言互译。

免费翻译文档

深度研究

AI帮你快速写综述,25分钟生成高质量综述,智能提取关键信息,辅助科研写作。

立即免费体验

电子健康记录中诊断测试结果的图形显示:8种系统的比较

Graphical display of diagnostic test results in electronic health records: a comparison of 8 systems.

作者信息

Sittig Dean F, Murphy Daniel R, Smith Michael W, Russo Elise, Wright Adam, Singh Hardeep

机构信息

School of Biomedical Informatics, University of Texas Health Science Center at Houston, TX, USA

Section of Health Services Research, Department of Medicine, Baylor College of Medicine, Houston, Texas, USA Houston VA Center for Innovations in Quality, Effectiveness and Safety, Michael E. DeBakey Veterans Affairs Medical Center, Houston, Texas.

出版信息

J Am Med Inform Assoc. 2015 Jul;22(4):900-4. doi: 10.1093/jamia/ocv013. Epub 2015 Mar 18.

DOI:10.1093/jamia/ocv013
PMID:25792704
原文链接:https://pmc.ncbi.nlm.nih.gov/articles/PMC4482275/
Abstract

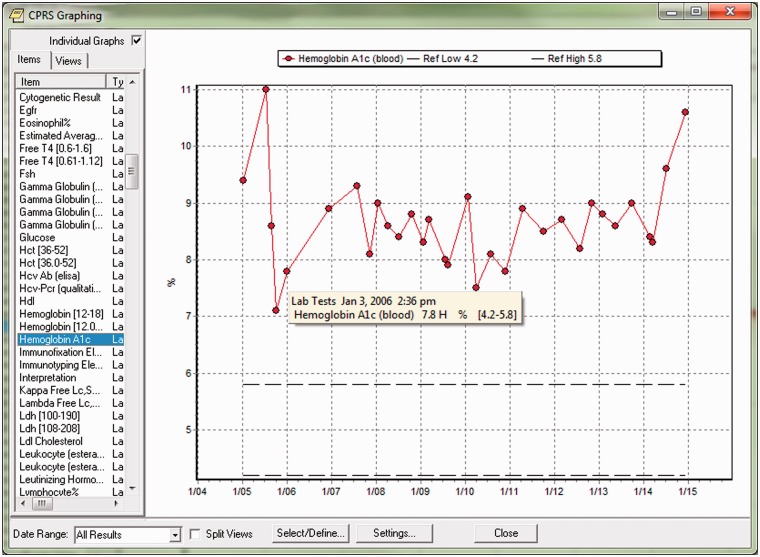
Accurate display and interpretation of clinical laboratory test results is essential for safe and effective diagnosis and treatment. In an attempt to ascertain how well current electronic health records (EHRs) facilitated these processes, we evaluated the graphical displays of laboratory test results in eight EHRs using objective criteria for optimal graphs based on literature and expert opinion. None of the EHRs met all 11 criteria; the magnitude of deficiency ranged from one EHR meeting 10 of 11 criteria to three EHRs meeting only 5 of 11 criteria. One criterion (i.e., the EHR has a graph with y-axis labels that display both the name of the measured variable and the units of measure) was absent from all EHRs. One EHR system graphed results in reverse chronological order. One EHR system plotted data collected at unequally-spaced points in time using equally-spaced data points, which had the effect of erroneously depicting the visual slope perception between data points. This deficiency could have a significant, negative impact on patient safety. Only two EHR systems allowed users to see, hover-over, or click on a data point to see the precise values of the x-y coordinates. Our study suggests that many current EHR-generated graphs do not meet evidence-based criteria aimed at improving laboratory data comprehension.

摘要

准确显示和解读临床实验室检测结果对于安全有效的诊断和治疗至关重要。为了确定当前的电子健康记录(EHR)在多大程度上有助于这些过程,我们根据文献和专家意见,使用优化图表的客观标准,评估了八个EHR中实验室检测结果的图形显示。没有一个EHR满足所有11项标准;缺陷程度从一个EHR满足11项标准中的10项到三个EHR仅满足11项标准中的5项不等。所有EHR都缺少一个标准(即EHR有一个带有y轴标签的图表,该标签同时显示测量变量的名称和测量单位)。一个EHR系统按时间倒序绘制结果。一个EHR系统使用等间距的数据点绘制在不等间距时间点收集的数据,这会错误地描绘数据点之间的视觉斜率感知。这种缺陷可能对患者安全产生重大负面影响。只有两个EHR系统允许用户查看、悬停或点击数据点以查看x-y坐标的精确值。我们的研究表明,当前许多由EHR生成的图表不符合旨在提高实验室数据理解的循证标准。

https://cdn.ncbi.nlm.nih.gov/pmc/blobs/fb8d/4482275/3560c8d4edb5/ocv013f3p.jpg
https://cdn.ncbi.nlm.nih.gov/pmc/blobs/fb8d/4482275/cccc4fb360f1/ocv013f1p.jpg
https://cdn.ncbi.nlm.nih.gov/pmc/blobs/fb8d/4482275/9ede678b7945/ocv013f2p.jpg
https://cdn.ncbi.nlm.nih.gov/pmc/blobs/fb8d/4482275/3560c8d4edb5/ocv013f3p.jpg
https://cdn.ncbi.nlm.nih.gov/pmc/blobs/fb8d/4482275/cccc4fb360f1/ocv013f1p.jpg
https://cdn.ncbi.nlm.nih.gov/pmc/blobs/fb8d/4482275/9ede678b7945/ocv013f2p.jpg
https://cdn.ncbi.nlm.nih.gov/pmc/blobs/fb8d/4482275/3560c8d4edb5/ocv013f3p.jpg

相似文献

1
Graphical display of diagnostic test results in electronic health records: a comparison of 8 systems.电子健康记录中诊断测试结果的图形显示:8种系统的比较
J Am Med Inform Assoc. 2015 Jul;22(4):900-4. doi: 10.1093/jamia/ocv013. Epub 2015 Mar 18.
2
A study of user requests regarding the fully electronic health record system at Seoul National University Bundang Hospital: challenges for future electronic health record systems.一项关于首尔国立大学盆唐医院全电子健康记录系统用户请求的研究:对未来电子健康记录系统的挑战。
Int J Med Inform. 2013 May;82(5):387-97. doi: 10.1016/j.ijmedinf.2012.08.004. Epub 2012 Sep 7.
3
A comparison of physician pre-adoption and adoption views on electronic health records in Canadian medical practices.加拿大医疗实践中医生对电子健康记录的预采用和采用观点比较。
J Med Internet Res. 2011 Aug 12;13(3):e57. doi: 10.2196/jmir.1726.
4
Assessing and comparing the usability of Chinese EHRs used in two Peking University hospitals to EHRs used in the US: A method of RUA.评估和比较北京大学两所医院使用的中文电子健康记录与美国使用的电子健康记录的可用性:一种基于RUA的方法。
Int J Med Inform. 2016 May;89:32-42. doi: 10.1016/j.ijmedinf.2016.02.008. Epub 2016 Feb 22.
5
Usability problems do not heal by themselves: National survey on physicians' experiences with EHRs in Finland.可用性问题不会自行解决:芬兰医生使用电子健康记录的全国性调查。
Int J Med Inform. 2017 Jan;97:266-281. doi: 10.1016/j.ijmedinf.2016.10.010. Epub 2016 Oct 17.
6
Mapping the Electronic Health Record: A Method to Study Display Fragmentation.绘制电子健康记录图谱:一种研究显示碎片化的方法。
Stud Health Technol Inform. 2017;245:1138-1142.
7
World-Wide Web-based graphical user interfaces for laboratory data.用于实验室数据的基于万维网的图形用户界面。
Methods Inf Med. 2002;41(5):411-3.
8
Electronic health record innovations: Helping physicians - One less click at a time.电子健康记录创新:帮助医生——一次少点击一次。
Health Inf Manag. 2017 Sep;46(3):140-144. doi: 10.1177/1833358316689481. Epub 2017 Jan 19.
9
Primary care practitioners' views on test result management in EHR-enabled health systems: a national survey.电子健康记录系统中检验结果管理的初级保健医生观点:一项全国性调查。
J Am Med Inform Assoc. 2013 Jul-Aug;20(4):727-35. doi: 10.1136/amiajnl-2012-001267. Epub 2012 Dec 25.
10
Definition, structure, content, use and impacts of electronic health records: a review of the research literature.电子健康记录的定义、结构、内容、用途及影响:研究文献综述
Int J Med Inform. 2008 May;77(5):291-304. doi: 10.1016/j.ijmedinf.2007.09.001. Epub 2007 Oct 22.

引用本文的文献

1
A step-by-step roadmap for the development and deployment of an electronic health record sidecar application that tracks patient outcomes: The RA PRO dashboard.用于开发和部署跟踪患者治疗结果的电子健康记录边车应用程序的分步路线图:RA PRO仪表板。
Digit Health. 2024 Oct 10;10:20552076241288739. doi: 10.1177/20552076241288739. eCollection 2024 Jan-Dec.
2
HistoriView: Implementation and Evaluation of a Novel Approach to Review a Patient Using a Scalable Space-Efficient Timeline without Zoom Interactions.历史视图:一种使用可扩展的空间高效时间线且无需缩放交互来查看患者的新方法的实现与评估。
Appl Clin Inform. 2024 Mar;15(2):250-264. doi: 10.1055/a-2269-0995. Epub 2024 Feb 15.
3

本文引用的文献

1
Summarization of clinical information: a conceptual model.临床信息总结:概念模型。
J Biomed Inform. 2011 Aug;44(4):688-99. doi: 10.1016/j.jbi.2011.03.008. Epub 2011 Mar 31.
2
Establishment of the permanent certification program for health information technology. Final rule.健康信息技术永久认证计划的制定。最终规则。
Fed Regist. 2011 Jan 7;76(5):1261-331.
3
The design and evaluation of a graphical display for laboratory data.实验室数据图形显示的设计与评估。
System Configuration Evaluation for a Province-Wide Clinical Information System Using the eSafety Checklist.
利用 eSafety 清单对全省临床信息系统进行系统配置评估。
Appl Clin Inform. 2023 Aug;14(4):735-742. doi: 10.1055/s-0043-1771392. Epub 2023 Sep 13.
4
Applying requisite imagination to safeguard electronic health record transitions.运用必要的想象力来保障电子健康记录的转换。
J Am Med Inform Assoc. 2022 Apr 13;29(5):1014-1018. doi: 10.1093/jamia/ocab291.
5
User-Centered System Design for Communicating Clinical Laboratory Test Results: Design and Evaluation Study.以用户为中心的临床检验结果沟通系统设计:设计与评估研究
JMIR Hum Factors. 2021 Nov 25;8(4):e26017. doi: 10.2196/26017.
6
Feeling and thinking: can theories of human motivation explain how EHR design impacts clinician burnout?感受与思考:动机理论能否解释电子健康记录设计如何影响临床医生倦怠?
J Am Med Inform Assoc. 2021 Apr 23;28(5):1042-1046. doi: 10.1093/jamia/ocaa270.
7
Graphical Presentations of Clinical Data in a Learning Electronic Medical Record.临床数据在学习型电子病历中的图形化展示。
Appl Clin Inform. 2020 Aug;11(4):680-691. doi: 10.1055/s-0040-1709707. Epub 2020 Oct 14.
8
Assessment of Health Information Technology-Related Outpatient Diagnostic Delays in the US Veterans Affairs Health Care System: A Qualitative Study of Aggregated Root Cause Analysis Data.美国退伍军人事务医疗保健系统中与健康信息技术相关的门诊诊断延迟评估:基于聚合根本原因分析数据的定性研究。
JAMA Netw Open. 2020 Jun 1;3(6):e206752. doi: 10.1001/jamanetworkopen.2020.6752.
9
Design and Prestudy Assessment of a Dashboard for Presenting Self-Collected Health Data of Patients With Diabetes to Clinicians: Iterative Approach and Qualitative Case Study.用于向临床医生展示糖尿病患者自我收集健康数据的仪表板的设计与预研究评估:迭代方法与定性案例研究
JMIR Diabetes. 2019 Jul 9;4(3):e14002. doi: 10.2196/14002.
10
Electronic health records systems and hospital clinical performance: a study of nationwide hospital data.电子健康记录系统与医院临床绩效:基于全国医院数据的研究。
J Am Med Inform Assoc. 2019 Oct 1;26(10):999-1009. doi: 10.1093/jamia/ocz092.
J Am Med Inform Assoc. 2010 Jul-Aug;17(4):416-24. doi: 10.1136/jamia.2009.000505.
4
Graphical perception and graphical methods for analyzing scientific data.图形感知和图形方法在科学数据分析中的应用。
Science. 1985 Aug 30;229(4716):828-33. doi: 10.1126/science.229.4716.828.
5
VistA--U.S. Department of Veterans Affairs national-scale HIS.退伍军人健康信息系统——美国退伍军人事务部的全国性医疗信息系统。
Int J Med Inform. 2003 Mar;69(2-3):135-56. doi: 10.1016/s1386-5056(02)00131-4.