Giordanengo Alain, Årsand Eirik, Woldaregay Ashenafi Zebene, Bradway Meghan, Grottland Astrid, Hartvigsen Gunnar, Granja Conceição, Torsvik Torbjørn, Hansen Anne Helen
Department of Computer Science, UiT The Arctic University of Norway, Tromsø, Norway.
Norwegian Centre for E-health Research, Tromsø, Norway.
JMIR Diabetes. 2019 Jul 9;4(3):e14002. doi: 10.2196/14002.
Introducing self-collected health data from patients with diabetes into consultation can be beneficial for both patients and clinicians. Such an initiative can allow patients to be more proactive in their disease management and clinicians to provide more tailored medical services. Optimally, electronic health record systems (EHRs) should be able to receive self-collected health data in a standard representation of medical data such as Fast Healthcare Interoperability Resources (FHIR), from patients systems like mobile health apps and display the data directly to their users-the clinicians. However, although Norwegian EHRs are working on implementing FHIR, no solution or graphical interface is available today to display self-collected health data.
The objective of this study was to design and assess a dashboard for displaying relevant self-collected health data from patients with diabetes to clinicians.
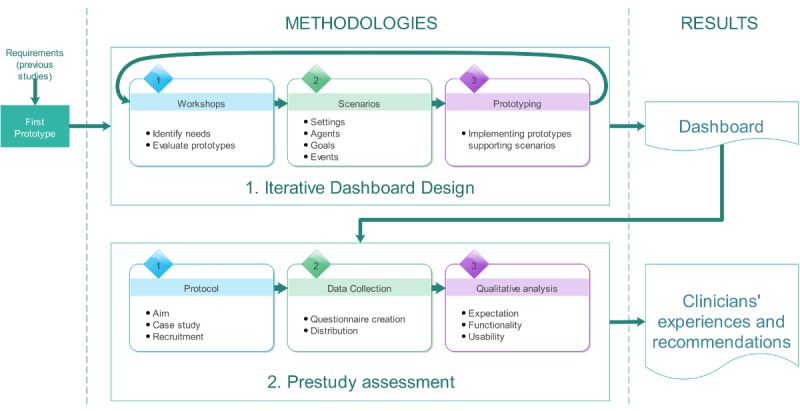
The design relied on an iterative participatory process involving workshops with patients, clinicians, and researchers to define which information should be available and how it should be displayed. The assessment is based on a case study, presenting an instance of the dashboard populated with data collected from one patient with diabetes type 1 (in-house researcher) face-to-face by 14 clinicians. We performed a qualitative analysis based on usability, functionality, and expectation by using responses to questionnaires that were distributed to the 14 clinicians at the end of the workshops and collected before the participants left. The qualitative assessment was guided by the Standards for Reporting Qualitative Research.
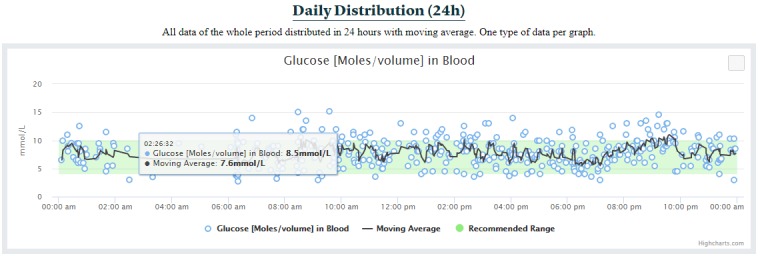
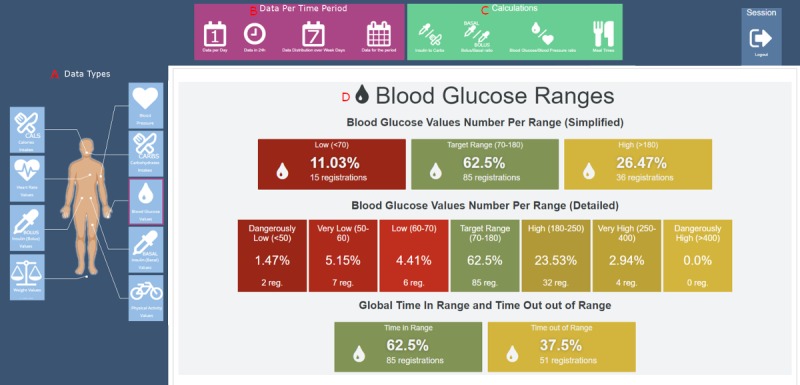
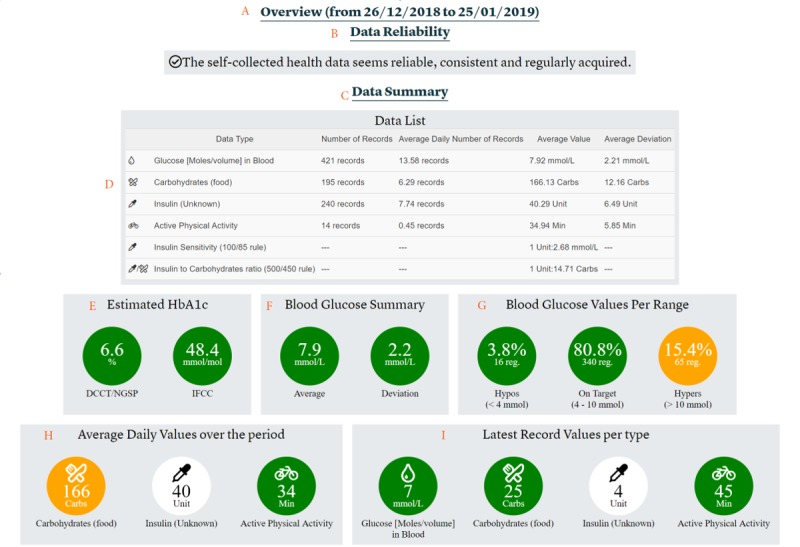
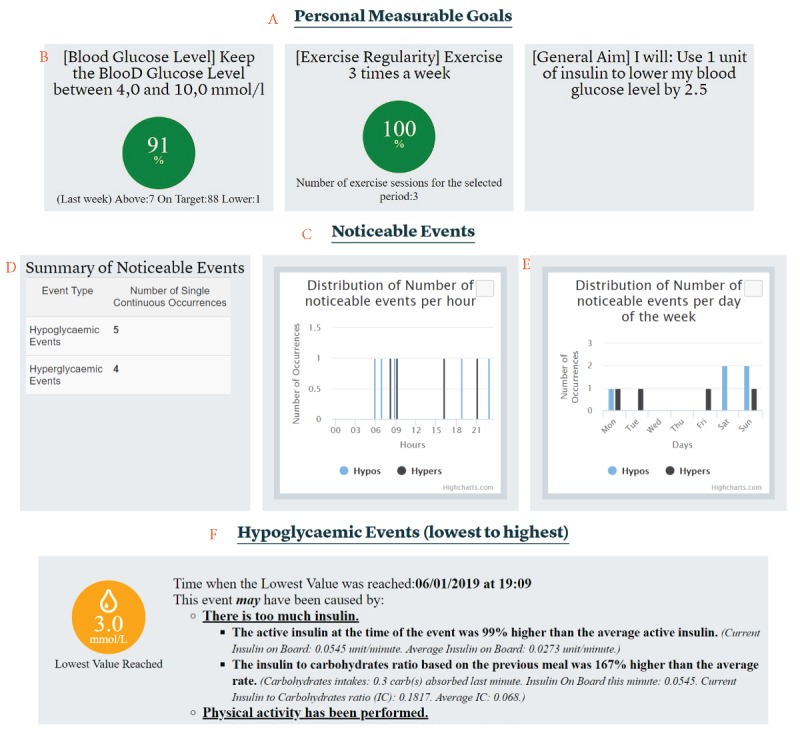
We created a dashboard permitting clinicians to assess the reliability of self-collected health data, list all collected data including medical calculations, and highlight medical situations that need to be investigated to improve the situation of the patients. The dashboard uses a combination of tables, graphs, and other visual representations to display the relevant information. Clinicians think that this type of solution will be useful during consultations every day, especially for patients living in remote areas or those who are technologically interested.
Displaying self-collected health data during consultations is not enough for clinicians; the data reliability has to be assured and the relevant information needs to be extracted and displayed along with the data to ease the introduction during a medical encounter. The prestudy assessment showed that the system provides relevant information to meet clinicians' need and that clinicians were eager to start using it during consultations. The system has been under testing in a medical trial since November 2018, and the first results of its assessment in a real-life situation are expected in the beginning of next year (2020).
将糖尿病患者自行收集的健康数据引入会诊对患者和临床医生都有益。这样的举措可以让患者在疾病管理中更加积极主动,也能让临床医生提供更具针对性的医疗服务。理想情况下,电子健康记录系统(EHRs)应该能够接收来自移动健康应用等患者系统以快速医疗互操作性资源(FHIR)等医学数据标准表示形式自行收集的健康数据,并将数据直接显示给其用户——临床医生。然而,尽管挪威的电子健康记录系统正在努力实施FHIR,但目前尚无解决方案或图形界面来显示自行收集的健康数据。
本研究的目的是设计并评估一个用于向临床医生展示糖尿病患者自行收集的相关健康数据的仪表板。
该设计依赖于一个迭代参与过程,包括与患者、临床医生和研究人员举办研讨会,以确定应提供哪些信息以及如何展示这些信息。评估基于一个案例研究,展示了一个仪表板实例,其中填充了由14名临床医生面对面从一名1型糖尿病患者(内部研究人员)收集的数据。我们通过使用在研讨会结束时分发给14名临床医生并在参与者离开前收集的问卷回复,基于可用性、功能和期望进行了定性分析。定性评估以定性研究报告标准为指导。
我们创建了一个仪表板,使临床医生能够评估自行收集的健康数据的可靠性,列出所有收集的数据,包括医学计算结果,并突出显示需要调查以改善患者状况的医疗情况。该仪表板使用表格、图表和其他视觉表示形式的组合来显示相关信息。临床医生认为这种类型的解决方案在日常会诊中会很有用,特别是对于居住在偏远地区或对技术感兴趣的患者。
在会诊期间展示自行收集的健康数据对临床医生来说还不够;必须确保数据的可靠性,并且需要提取相关信息并与数据一起显示,以便在医疗问诊期间便于引入。预研究评估表明,该系统提供了满足临床医生需求的相关信息,并且临床医生渴望在会诊期间开始使用它。该系统自2018年11月起一直在进行临床试验测试,预计明年年初(2020年)会得出其在实际应用中的首次评估结果。