Vos Peter G, Paulo M João, Voorrips Roeland E, Visser Richard G F, van Eck Herman J, van Eeuwijk Fred A
Plant Breeding, Wageningen University and Research, P.O. Box 386, 6700 AJ, Wageningen, The Netherlands.
Biometris, Wageningen University and Research, P.O. Box 16, 6700 AA, Wageningen, The Netherlands.
Theor Appl Genet. 2017 Jan;130(1):123-135. doi: 10.1007/s00122-016-2798-8. Epub 2016 Oct 3.
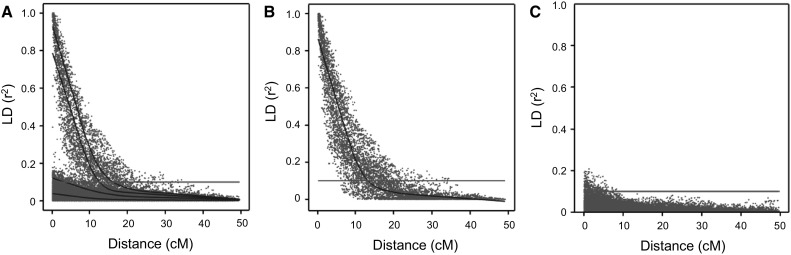
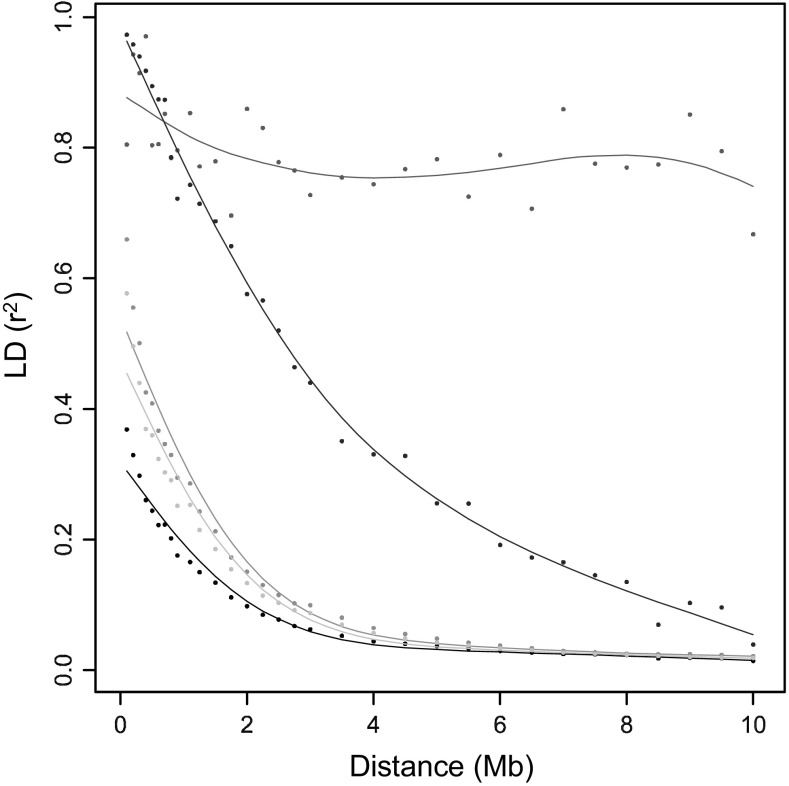
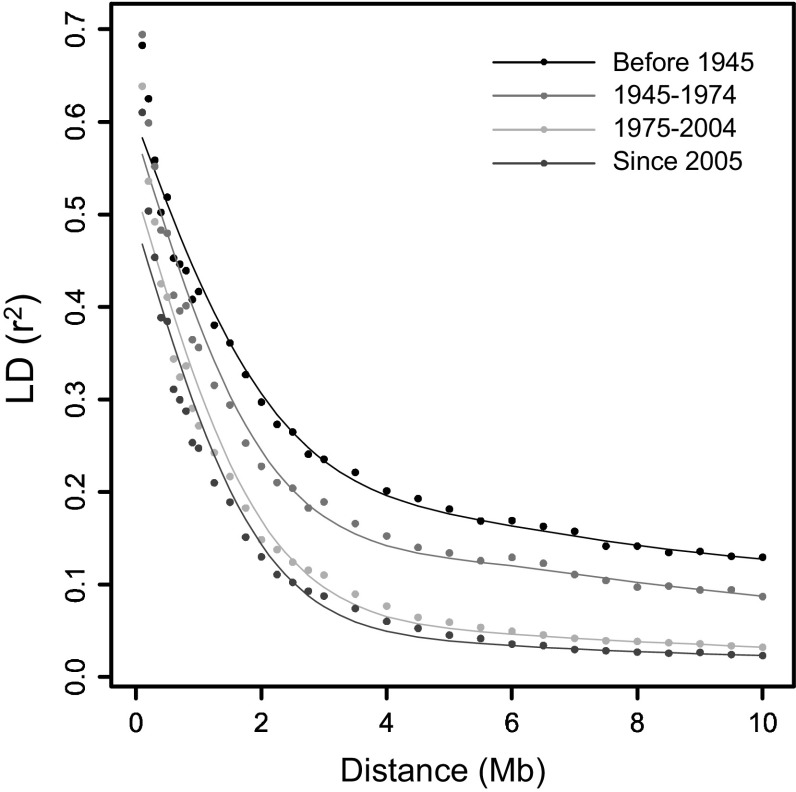
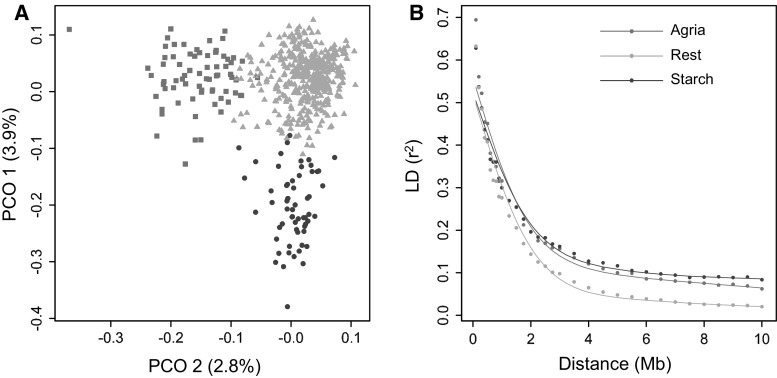
The number of SNPs required for QTL discovery is justified by the distance at which linkage disequilibrium has decayed. Simulations and real potato SNP data showed how to estimate and interpret LD decay. The magnitude of linkage disequilibrium (LD) and its decay with genetic distance determine the resolution of association mapping, and are useful for assessing the desired numbers of SNPs on arrays. To study LD and LD decay in tetraploid potato, we simulated autotetraploid genotypes and used it to explore the dependence on: (1) the number of haplotypes in the population (the amount of genetic variation) and (2) the percentage of haplotype specific SNPs (hs-SNPs). Several estimators for short-range LD were explored, such as the average r , median r , and other percentiles of r (80, 90, and 95 %). For LD decay, we looked at LD, the distance at which the short-range LD is halved when using the 90 % percentile of r at short range, as estimator for LD. Simulations showed that the performance of various estimators for LD decay strongly depended on the number of haplotypes, although the real value of LD decay was not influenced very much by this number. The estimator LD was chosen to evaluate LD decay in 537 tetraploid varieties. LD values were 1.5 Mb for varieties released before 1945 and 0.6 Mb in varieties released after 2005. LD values within three different subpopulations ranged from 0.7 to 0.9 Mb. LD was 2.5 Mb for introgressed regions, indicating large haplotype blocks. In pericentromeric heterochromatin, LD decay was negligible. This study demonstrates that several related factors influencing LD decay could be disentangled, that no universal approach can be suggested, and that the estimation of LD decay has to be performed with great care and knowledge of the sampled material.
用于QTL发现所需的单核苷酸多态性(SNP)数量可通过连锁不平衡衰减的距离来确定。模拟和真实的马铃薯SNP数据展示了如何估计和解释连锁不平衡衰减。连锁不平衡(LD)的程度及其随遗传距离的衰减决定了关联作图的分辨率,并且对于评估芯片上所需的SNP数量很有用。为了研究四倍体马铃薯中的连锁不平衡和连锁不平衡衰减,我们模拟了同源四倍体基因型,并利用它来探究对以下因素的依赖性:(1)群体中的单倍型数量(遗传变异量)和(2)单倍型特异性SNP(hs-SNP)的百分比。我们探索了几种用于短程连锁不平衡的估计方法,例如平均r、中位数r以及r的其他百分位数(80%、90%和95%)。对于连锁不平衡衰减,我们将连锁不平衡(LD),即使用短程r的90%百分位数时短程连锁不平衡减半的距离,作为连锁不平衡的估计值。模拟表明,尽管连锁不平衡衰减的实际值受此数量的影响不大,但各种连锁不平衡衰减估计方法的性能强烈依赖于单倍型数量。我们选择估计值LD来评估537个四倍体品种中的连锁不平衡衰减。1945年之前发布的品种的LD值为1.5 Mb,2005年之后发布的品种的LD值为0.6 Mb。三个不同亚群体内的LD值范围为0.7至0.9 Mb。渗入区域的LD为2.5 Mb,表明存在大的单倍型块。在着丝粒周围的异染色质中,连锁不平衡衰减可以忽略不计。这项研究表明,可以区分影响连锁不平衡衰减的几个相关因素,无法提出通用方法,并且连锁不平衡衰减的估计必须非常谨慎并了解所采样材料的情况。