• 文献检索
  • 文档翻译
  • 深度研究
  • 学术资讯
  • Suppr Zotero 插件Zotero 插件
  • 邀请有礼
  • 套餐&价格
  • 历史记录
应用&插件
Suppr Zotero 插件Zotero 插件浏览器插件Mac 客户端Windows 客户端微信小程序
定价
高级版会员购买积分包购买API积分包
服务
文献检索文档翻译深度研究API 文档MCP 服务
关于我们
关于 Suppr公司介绍联系我们用户协议隐私条款
关注我们

Suppr 超能文献

核心技术专利:CN118964589B侵权必究
粤ICP备2023148730 号-1Suppr @ 2026

文献检索

告别复杂PubMed语法,用中文像聊天一样搜索,搜遍4000万医学文献。AI智能推荐,让科研检索更轻松。

立即免费搜索

文件翻译

保留排版,准确专业,支持PDF/Word/PPT等文件格式,支持 12+语言互译。

免费翻译文档

深度研究

AI帮你快速写综述,25分钟生成高质量综述,智能提取关键信息,辅助科研写作。

立即免费体验

中国内地 PM 浓度的时空分布特征及其地理加权回归分析。

Spatiotemporal Pattern of PM Concentrations in Mainland China and Analysis of Its Influencing Factors using Geographically Weighted Regression.

机构信息

Key Laboratory for Satellite Mapping Technology and Applications of State Administration of Surveying, Mapping and Geoinformation of China, Nanjing University, Nanjing 210023, China.

Jiangsu Provincial Key Laboratory of Geographic Information Science and Technology, Nanjing University, Nanjing 210023, China.

出版信息

Sci Rep. 2017 Jan 12;7:40607. doi: 10.1038/srep40607.

DOI:10.1038/srep40607
PMID:28079138
原文链接:https://pmc.ncbi.nlm.nih.gov/articles/PMC5228184/
Abstract

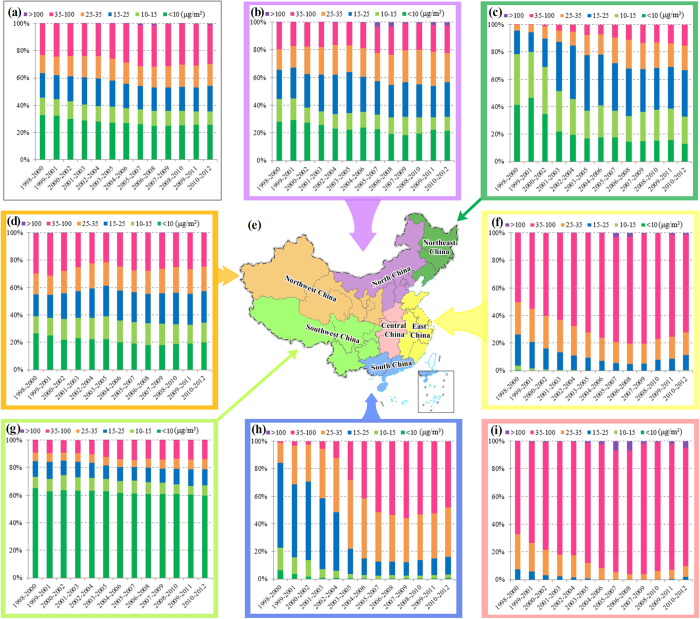
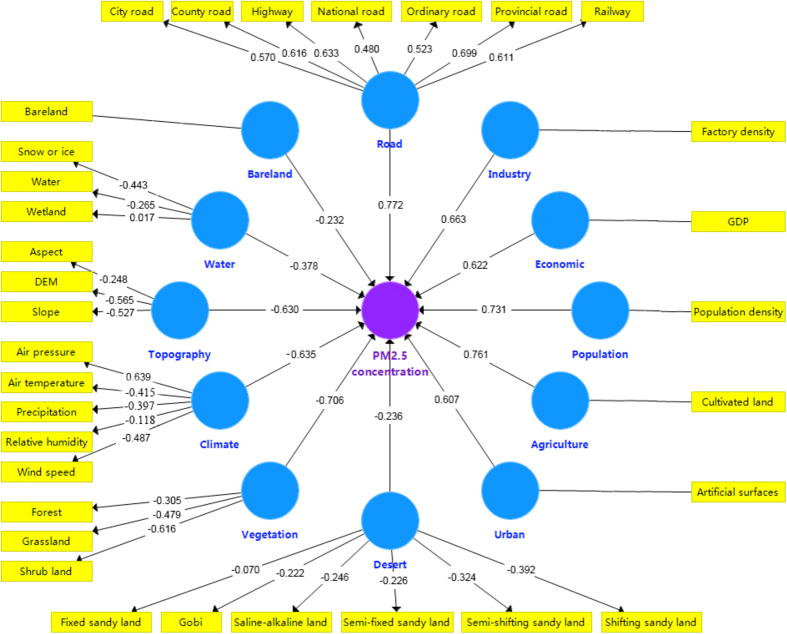
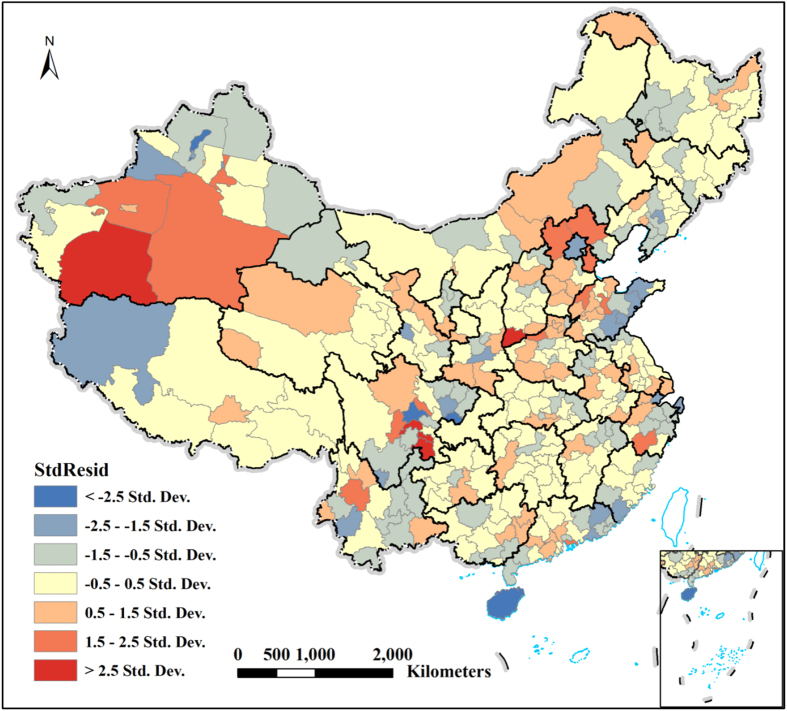
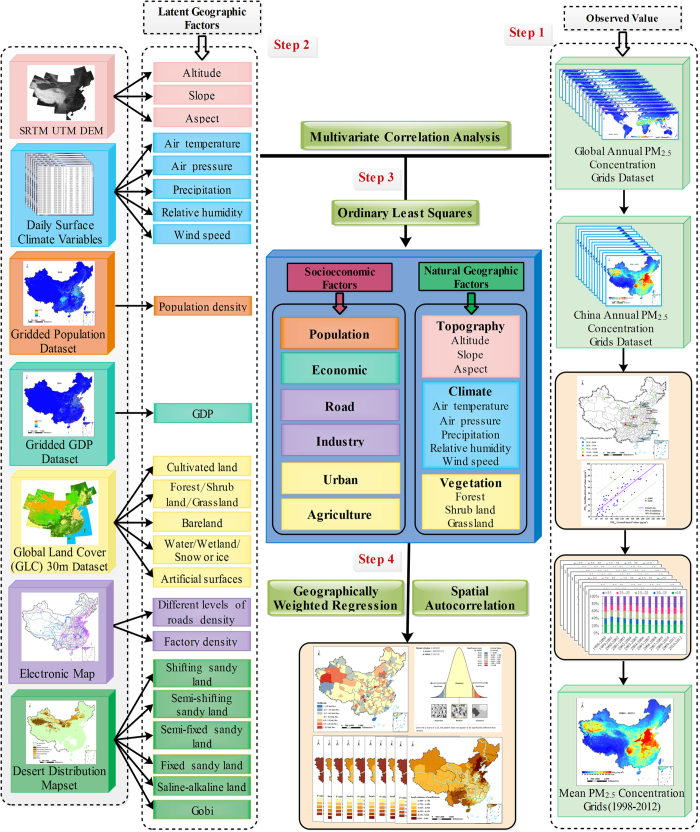
Based on annual average PM gridded dataset, this study first analyzed the spatiotemporal pattern of PM across Mainland China during 1998-2012. Then facilitated with meteorological site data, land cover data, population and Gross Domestic Product (GDP) data, etc., the contributions of latent geographic factors, including socioeconomic factors (e.g., road, agriculture, population, industry) and natural geographical factors (e.g., topography, climate, vegetation) to PM were explored through Geographically Weighted Regression (GWR) model. The results revealed that PM concentrations increased while the spatial pattern remained stable, and the proportion of areas with PM concentrations greater than 35 μg/m significantly increased from 23.08% to 29.89%. Moreover, road, agriculture, population and vegetation showed the most significant impacts on PM. Additionally, the Moran's I for the residuals of GWR was 0.025 (not significant at a 0.01 level), indicating that the GWR model was properly specified. The local coefficient estimates of GDP in some cities were negative, suggesting the existence of the inverted-U shaped Environmental Kuznets Curve (EKC) for PM in Mainland China. The effects of each latent factor on PM in various regions were different. Therefore, regional measures and strategies for controlling PM should be formulated in terms of the local impacts of specific factors.

摘要

本研究基于年均 PM 网格化数据集,首次分析了 1998-2012 年中国大陆地区 PM 的时空分布格局。然后,利用气象站点数据、土地覆盖数据、人口和国内生产总值(GDP)等数据,通过地理加权回归(GWR)模型,探讨了潜在地理因素(包括社会经济因素,如道路、农业、人口、工业和自然地理因素,如地形、气候、植被)对 PM 的贡献。结果表明,PM 浓度呈上升趋势,空间格局保持稳定,PM 浓度大于 35μg/m3 的地区比例从 23.08%显著增加到 29.89%。此外,道路、农业、人口和植被对 PM 的影响最大。此外,GWR 残差的 Moran's I 为 0.025(在 0.01 水平上不显著),表明 GWR 模型的指定是恰当的。一些城市 GDP 的局部系数估计值为负,表明中国大陆 PM 存在倒 U 型环境库兹涅茨曲线(EKC)。各潜在因素对不同地区 PM 的影响不同。因此,应根据特定因素对当地的影响,制定针对 PM 的区域性措施和策略。

https://cdn.ncbi.nlm.nih.gov/pmc/blobs/1cdc/5228184/6cb241917cd9/srep40607-f6.jpg
https://cdn.ncbi.nlm.nih.gov/pmc/blobs/1cdc/5228184/80798af2079d/srep40607-f1.jpg
https://cdn.ncbi.nlm.nih.gov/pmc/blobs/1cdc/5228184/e2a2721727da/srep40607-f2.jpg
https://cdn.ncbi.nlm.nih.gov/pmc/blobs/1cdc/5228184/dbf8123d3a5b/srep40607-f3.jpg
https://cdn.ncbi.nlm.nih.gov/pmc/blobs/1cdc/5228184/4dadd046d49f/srep40607-f4.jpg
https://cdn.ncbi.nlm.nih.gov/pmc/blobs/1cdc/5228184/a208d91297e9/srep40607-f5.jpg
https://cdn.ncbi.nlm.nih.gov/pmc/blobs/1cdc/5228184/6cb241917cd9/srep40607-f6.jpg

相似文献

1
Spatiotemporal Pattern of PM Concentrations in Mainland China and Analysis of Its Influencing Factors using Geographically Weighted Regression.中国内地 PM 浓度的时空分布特征及其地理加权回归分析。
Sci Rep. 2017 Jan 12;7:40607. doi: 10.1038/srep40607.
2
Spatio-temporal variation of PM2.5 concentrations and their relationship with geographic and socioeconomic factors in China.中国PM2.5浓度的时空变化及其与地理和社会经济因素的关系。
Int J Environ Res Public Health. 2013 Dec 20;11(1):173-86. doi: 10.3390/ijerph110100173.
3
Ingestion of GNSS-Derived ZTD and PWV for Spatial Interpolation of PM Concentration in Central and Southern China.利用 GNSS 反演的天顶延迟和 PWV 对中国中南部 PM 浓度进行空间插值。
Int J Environ Res Public Health. 2021 Jul 27;18(15):7931. doi: 10.3390/ijerph18157931.
4
Local spatial variations analysis of smear-positive tuberculosis in Xinjiang using Geographically Weighted Regression model.基于地理加权回归模型的新疆涂阳肺结核局部空间变异分析
BMC Public Health. 2016 Oct 6;16(1):1058. doi: 10.1186/s12889-016-3723-4.
5
[Analysis of the Temporal and Spatial Variation of PM in China Based on the LUR Model].基于土地利用回归(LUR)模型的中国颗粒物时空变化分析
Huan Jing Ke Xue. 2018 Dec 8;39(12):5296-5307. doi: 10.13227/j.hjkx.201805051.
6
The contributions of socioeconomic indicators to global PM based on the hybrid method of spatial econometric model and geographical and temporal weighted regression.基于空间计量经济学模型和时空加权回归的混合方法对全球 PM 的社会经济指标的贡献。
Sci Total Environ. 2020 Feb 10;703:135481. doi: 10.1016/j.scitotenv.2019.135481. Epub 2019 Nov 15.
7
Spatial Variation of the Relationship between PM 2.5 Concentrations and Meteorological Parameters in China.中国PM2.5浓度与气象参数关系的空间变化
Biomed Res Int. 2015;2015:684618. doi: 10.1155/2015/684618. Epub 2015 Jul 29.
8
[Interannual Characteristics of Fine Particulate Matter in North China and Its Relationship with Land Use and Land Cover Change].[华北地区细颗粒物的年际特征及其与土地利用和土地覆盖变化的关系]
Huan Jing Ke Xue. 2020 Jul 8;41(7):2995-3003. doi: 10.13227/j.hjkx.201911079.
9
Identifying the socioeconomic determinants of population exposure to particulate matter (PM) in China using geographically weighted regression modeling.利用地理加权回归建模识别中国人群颗粒物(PM)暴露的社会经济决定因素。
Environ Pollut. 2018 Oct;241:494-503. doi: 10.1016/j.envpol.2018.05.083. Epub 2018 Jun 4.
10
Evaluating heterogeneity in indoor and outdoor air pollution using land-use regression and constrained factor analysis.利用土地利用回归和约束因子分析评估室内和室外空气污染的异质性。
Res Rep Health Eff Inst. 2010 Dec(152):5-80; discussion 81-91.

引用本文的文献

1
Impact of PM, relative humidity, and temperature on sleep quality: a cross-sectional study in Taipei.细颗粒物、相对湿度和温度对睡眠质量的影响:台北的一项横断面研究。
Ann Med. 2025 Dec;57(1):2448733. doi: 10.1080/07853890.2024.2448733. Epub 2025 Jan 9.
2
Spatial and temporal characteristic of PM2.5 and influence factors in the Yellow River Basin.黄河流域 PM2.5 的时空特征及影响因素。
Front Public Health. 2024 Jul 31;12:1403414. doi: 10.3389/fpubh.2024.1403414. eCollection 2024.
3
Wintertime investigation of PM concentrations, sources, and relationship with different meteorological parameters.

本文引用的文献

1
A land use regression application into assessing spatial variation of intra-urban fine particulate matter (PM2.5) and nitrogen dioxide (NO2) concentrations in City of Shanghai, China.应用土地利用回归模型评估中国上海市城区内细颗粒物(PM2.5)和二氧化氮(NO2)浓度的空间变异性。
Sci Total Environ. 2016 Sep 15;565:607-615. doi: 10.1016/j.scitotenv.2016.03.189. Epub 2016 May 18.
2
Long-term variation of black carbon and PM2.5 in Beijing, China with respect to meteorological conditions and governmental measures.中国北京黑碳和 PM2.5 的长期变化与气象条件和政府措施有关。
Environ Pollut. 2016 May;212:269-278. doi: 10.1016/j.envpol.2016.01.008. Epub 2016 Feb 5.
3
冬季颗粒物浓度、来源及其与不同气象参数关系的调查
Sci Rep. 2024 Jan 2;14(1):154. doi: 10.1038/s41598-023-49714-w.
4
Spatiotemporal characteristic analysis of PM in central China and modeling of driving factors based on MGWR: a case study of Henan Province.基于 MGWR 的中国中部地区 PM 时空特征分析及驱动因素建模:以河南省为例。
Front Public Health. 2023 Dec 5;11:1295468. doi: 10.3389/fpubh.2023.1295468. eCollection 2023.
5
Estimating ground-level PM using subset regression model and machine learning algorithms in Asian megacity, Dhaka, Bangladesh.在孟加拉国达卡这座亚洲大城市中,使用子集回归模型和机器学习算法估算地面颗粒物(PM)。
Air Qual Atmos Health. 2023;16(6):1117-1139. doi: 10.1007/s11869-023-01329-w. Epub 2023 Feb 25.
6
What Factors Dominate the Change of PM in the World from 2000 to 2019? A Study from Multi-Source Data.是什么因素主导了 2000 年至 2019 年期间全球 PM 的变化?一项多源数据研究。
Int J Environ Res Public Health. 2023 Jan 27;20(3):2282. doi: 10.3390/ijerph20032282.
7
Spatiotemporal distribution, trend, forecast, and influencing factors of transboundary and local air pollutants in Nagasaki Prefecture, Japan.日本长崎县跨境和本地空气污染物的时空分布、趋势、预测及影响因素。
Sci Rep. 2023 Jan 16;13(1):851. doi: 10.1038/s41598-023-27936-2.
8
Understanding Anthropogenic PM Concentrations and Their Drivers in China during 1998-2016.理解 1998-2016 年期间中国人为 PM 浓度及其驱动因素。
Int J Environ Res Public Health. 2022 Dec 30;20(1):695. doi: 10.3390/ijerph20010695.
9
How Does Digitalization Affect Haze Pollution? The Mediating Role of Energy Consumption.数字化如何影响雾霾污染?能源消耗的中介作用。
Int J Environ Res Public Health. 2022 Sep 6;19(18):11204. doi: 10.3390/ijerph191811204.
10
Spatiotemporal Distribution of Continuous Air Pollution and Its Relationship with Socioeconomic and Natural Factors in China.中国持续空气污染的时空分布及其与社会经济和自然因素的关系。
Int J Environ Res Public Health. 2022 May 29;19(11):6635. doi: 10.3390/ijerph19116635.
Experimental examination of effectiveness of vegetation as bio-filter of particulate matters in the urban environment.
城市环境中植被作为颗粒物生物过滤器有效性的实验研究。
Environ Pollut. 2016 Jan;208(Pt A):198-208. doi: 10.1016/j.envpol.2015.09.006. Epub 2015 Sep 15.
4
City as a major source area of fine particulate (PM2.5) in China.在中国,城市是细颗粒物(PM2.5)的主要来源地。
Environ Pollut. 2015 Nov;206:183-7. doi: 10.1016/j.envpol.2015.06.038. Epub 2015 Jul 12.
5
Relationships between meteorological parameters and criteria air pollutants in three megacities in China.中国三个特大城市气象参数与空气质量标准污染物之间的关系。
Environ Res. 2015 Jul;140:242-54. doi: 10.1016/j.envres.2015.04.004. Epub 2015 Apr 13.
6
Spatial and seasonal variations of PM2.5 mass and species during 2010 in Xi'an, China.2010 年中国西安 PM2.5 质量和成分的时空变化。
Sci Total Environ. 2015 Mar 1;508:477-87. doi: 10.1016/j.scitotenv.2014.11.007. Epub 2014 Dec 13.
7
PM₂.₅ opened a door to public participation addressing environmental challenges in China.细颗粒物为中国公众参与应对环境挑战开启了一扇大门。
Environ Pollut. 2015 Feb;197:313-315. doi: 10.1016/j.envpol.2014.12.001. Epub 2014 Dec 8.
8
Use of satellite observations for long-term exposure assessment of global concentrations of fine particulate matter.利用卫星观测进行全球细颗粒物浓度的长期暴露评估。
Environ Health Perspect. 2015 Feb;123(2):135-43. doi: 10.1289/ehp.1408646. Epub 2014 Oct 24.
9
Impact of urbanization level on urban air quality: a case of fine particles (PM(2.5)) in Chinese cities.城市化水平对城市空气质量的影响:以中国城市细颗粒物(PM2.5)为例。
Environ Pollut. 2014 Nov;194:163-170. doi: 10.1016/j.envpol.2014.07.022. Epub 2014 Aug 9.
10
Society: Realizing China's urban dream.社会:实现中国的城市梦想。
Nature. 2014 May 8;509(7499):158-60. doi: 10.1038/509158a.