Chu Anne H Y, Ng Sheryl H X, Paknezhad Mahsa, Gauterin Alvaro, Koh David, Brown Michael S, Müller-Riemenschneider Falk
Saw Swee Hock School of Public Health, National University of Singapore, Singapore, Singapore.
Department of Computer Science, School of Computing, National University of Singapore, Singapore, Singapore.
PLoS One. 2017 Feb 24;12(2):e0172535. doi: 10.1371/journal.pone.0172535. eCollection 2017.
Accelerometers are commonly used to assess physical activity. Consumer activity trackers have become increasingly popular today, such as the Fitbit. This study aimed to compare the average number of steps per day using the wrist-worn Fitbit Flex and waist-worn ActiGraph (wGT3X-BT) in free-living conditions.
104 adult participants (n = 35 males; n = 69 females) were asked to wear a Fitbit Flex and an ActiGraph concurrently for 7 days. Daily step counts were used to classify inactive (<10,000 steps) and active (≥10,000 steps) days, which is one of the commonly used physical activity guidelines to maintain health. Proportion of agreement between physical activity categorizations from ActiGraph and Fitbit Flex was assessed. Statistical analyses included Spearman's rho, intraclass correlation (ICC), median absolute percentage error (MAPE), Kappa statistics, and Bland-Altman plots. Analyses were performed among all participants, by each step-defined daily physical activity category and gender.
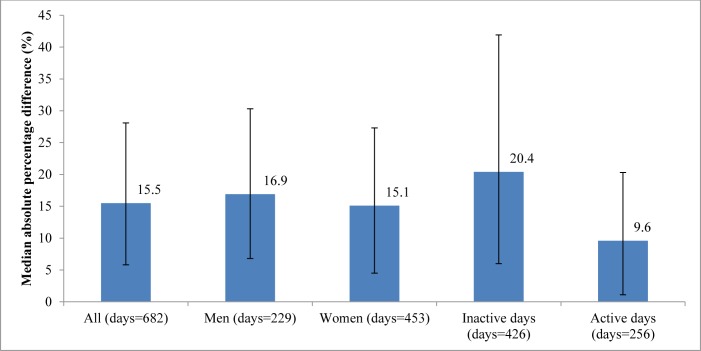
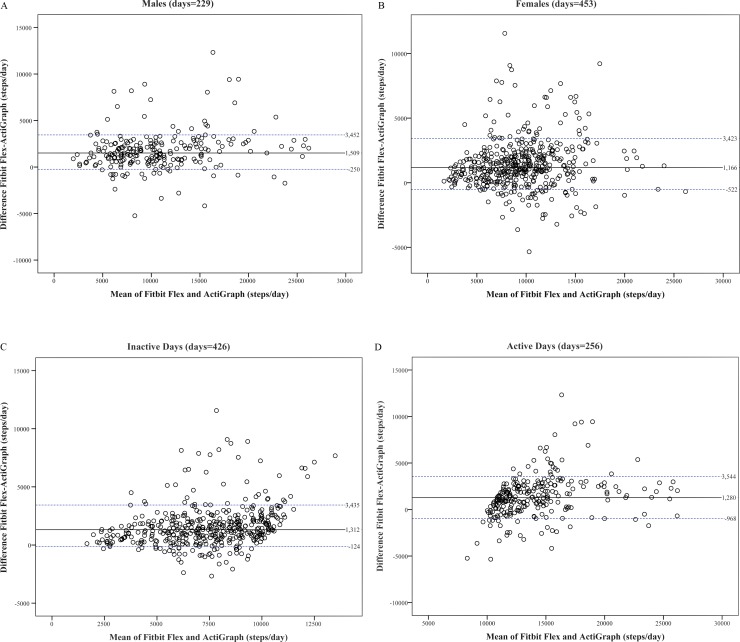
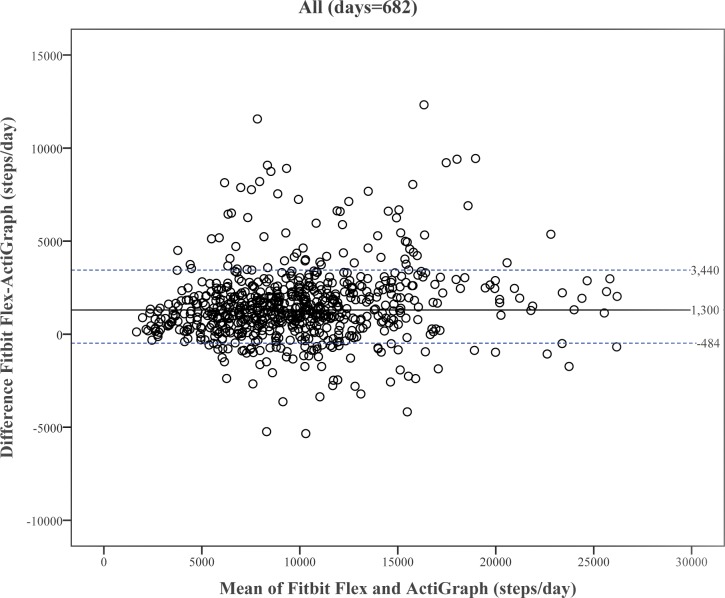
The median average steps/day recorded by Fitbit Flex and ActiGraph were 10193 and 8812, respectively. Strong positive correlations and agreement were found for all participants, both genders, as well as daily physical activity categories (Spearman's rho: 0.76-0.91; ICC: 0.73-0.87). The MAPE was: 15.5% (95% confidence interval [CI]: 5.8-28.1%) for overall steps, 16.9% (6.8-30.3%) vs. 15.1% (4.5-27.3%) in males and females, and 20.4% (8.7-35.9%) vs. 9.6% (1.0-18.4%) during inactive days and active days. Bland-Altman plot indicated a median overestimation of 1300 steps/day by the Fitbit Flex in all participants. Fitbit Flex and ActiGraph respectively classified 51.5% and 37.5% of the days as active (Kappa: 0.66).
There were high correlations and agreement in steps between Fitbit Flex and ActiGraph. However, findings suggested discrepancies in steps between devices. This imposed a challenge that needs to be considered when using Fibit Flex in research and health promotion programs.
加速度计常用于评估身体活动。如今,诸如Fitbit之类的消费级活动追踪器越来越受欢迎。本研究旨在比较在自由生活条件下,佩戴在手腕上的Fitbit Flex和佩戴在腰部的ActiGraph(wGT3X - BT)每日的平均步数。
104名成年参与者(n = 35名男性;n = 69名女性)被要求同时佩戴Fitbit Flex和ActiGraph 7天。每日步数用于将不活跃日(<10,000步)和活跃日(≥10,000步)进行分类,这是维持健康常用的身体活动指南之一。评估了ActiGraph和Fitbit Flex对身体活动分类的一致性比例。统计分析包括Spearman秩相关系数、组内相关系数(ICC)、中位数绝对百分比误差(MAPE)、Kappa统计量以及Bland - Altman图。在所有参与者中,按每日身体活动分类和性别分别进行分析。
Fitbit Flex和ActiGraph记录到的每日平均步数中位数分别为10193步和8812步。在所有参与者、男女两性以及每日身体活动分类中均发现了强正相关和一致性(Spearman秩相关系数:0.76 - 0.91;ICC:0.73 - 0.87)。总体步数的MAPE为:15.5%(95%置信区间[CI]:5.8 - 28.1%),男性为16.9%(6.8 - 30.3%),女性为15.1%(4.5 - 27.3%),不活跃日为20.4%(8.7 - 35.9%),活跃日为9.6%(1.0 - 18.4%)。Bland - Altman图表明,在所有参与者中,Fitbit Flex每日步数中位数高估了1300步。Fitbit Flex和ActiGraph分别将51.5%和37.5%的日子分类为活跃日(Kappa值:0.66)。
Fitbit Flex和ActiGraph在步数方面具有高度相关性和一致性。然而,研究结果表明不同设备之间在步数上存在差异。这给在研究和健康促进项目中使用Fitbit Flex时带来了一个需要考虑的挑战。