Lancet. 2017 May 20;389(10083):1981-2004. doi: 10.1016/S0140-6736(17)30874-7. Epub 2017 Apr 19.
An adequate amount of prepaid resources for health is important to ensure access to health services and for the pursuit of universal health coverage. Previous studies on global health financing have described the relationship between economic development and health financing. In this study, we further explore global health financing trends and examine how the sources of funds used, types of services purchased, and development assistance for health disbursed change with economic development. We also identify countries that deviate from the trends.
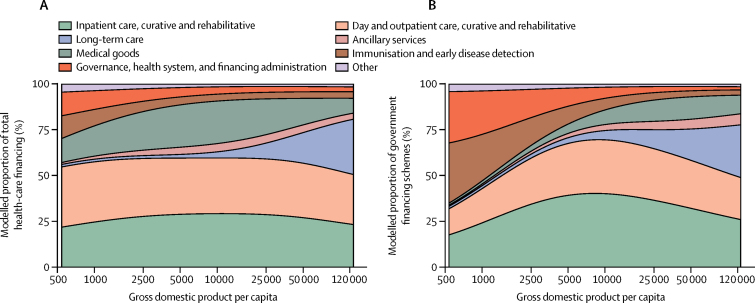
We estimated national health spending by type of care and by source, including development assistance for health, based on a diverse set of data including programme reports, budget data, national estimates, and 964 National Health Accounts. These data represent health spending for 184 countries from 1995 through 2014. We converted these data into a common inflation-adjusted and purchasing power-adjusted currency, and used non-linear regression methods to model the relationship between health financing, time, and economic development.
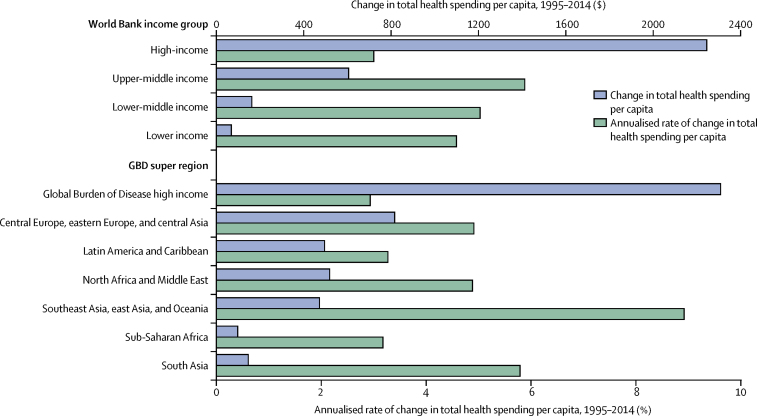
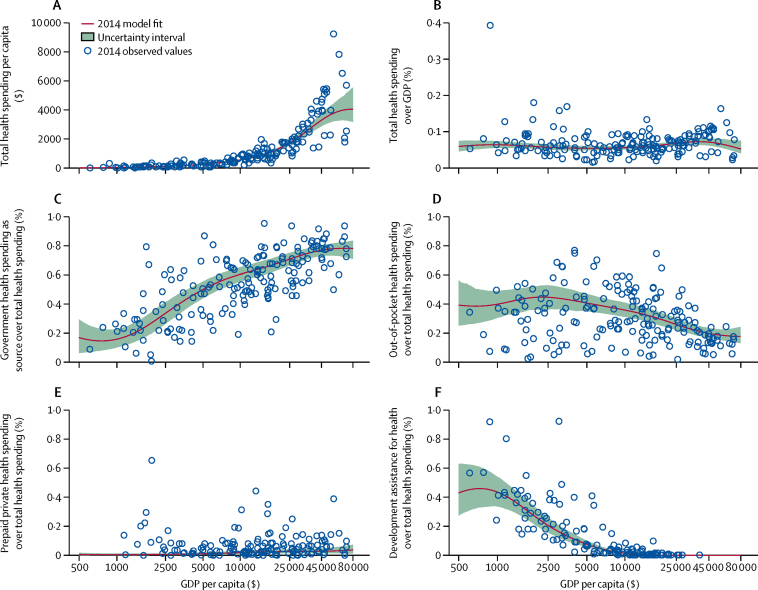
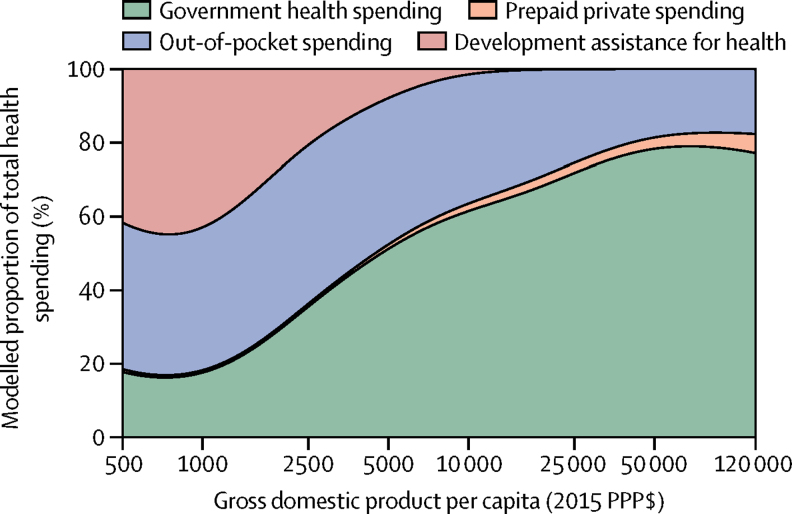
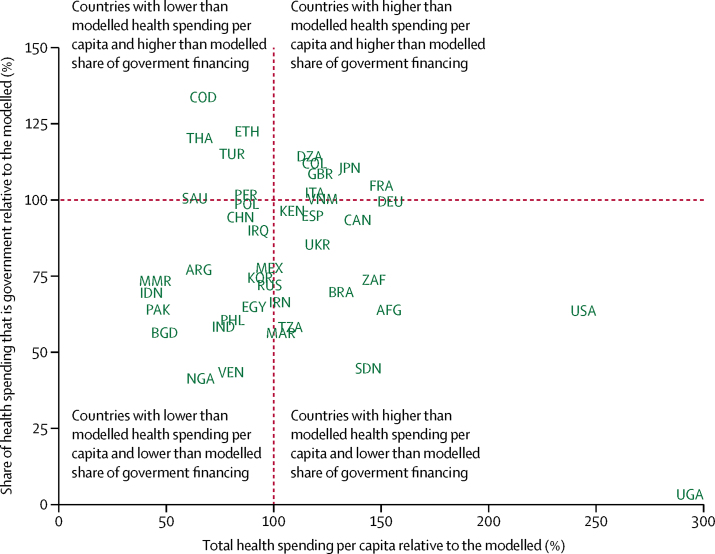
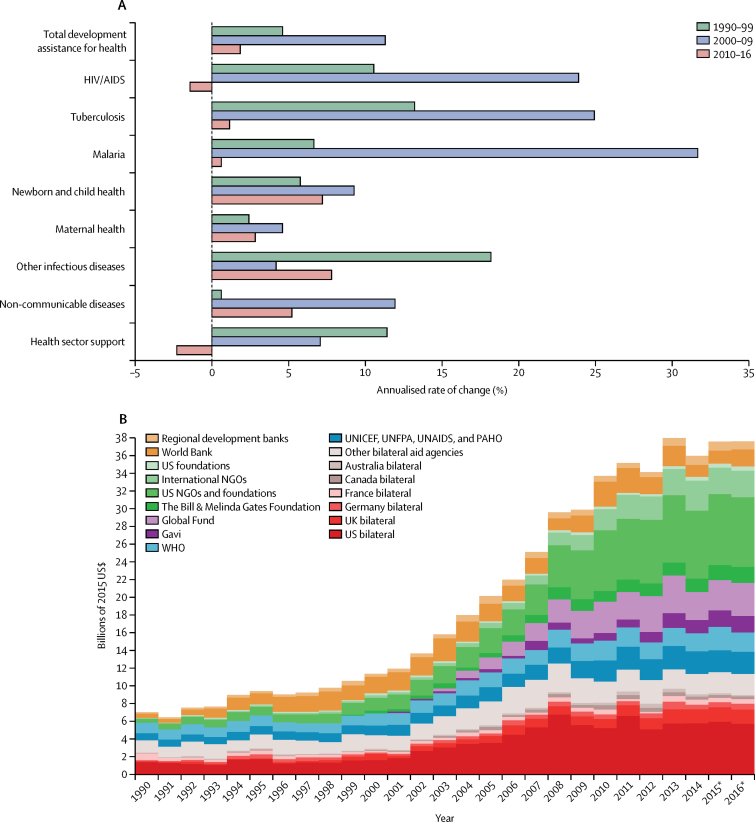
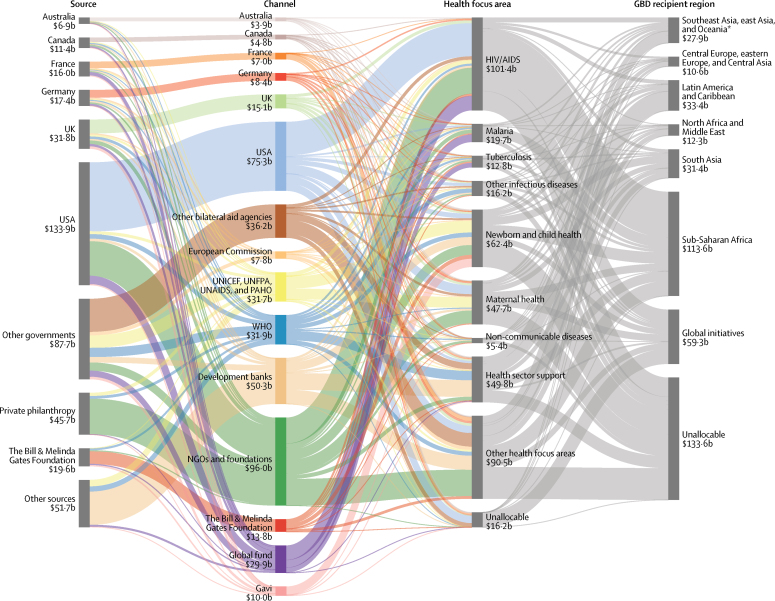
Between 1995 and 2014, economic development was positively associated with total health spending and a shift away from a reliance on development assistance and out-of-pocket (OOP) towards government spending. The largest absolute increase in spending was in high-income countries, which increased to purchasing power-adjusted $5221 per capita based on an annual growth rate of 3·0%. The largest health spending growth rates were in upper-middle-income (5·9) and lower-middle-income groups (5·0), which both increased spending at more than 5% per year, and spent $914 and $267 per capita in 2014, respectively. Spending in low-income countries grew nearly as fast, at 4·6%, and health spending increased from $51 to $120 per capita. In 2014, 59·2% of all health spending was financed by the government, although in low-income and lower-middle-income countries, 29·1% and 58·0% of spending was OOP spending and 35·7% and 3·0% of spending was development assistance. Recent growth in development assistance for health has been tepid; between 2010 and 2016, it grew annually at 1·8%, and reached US$37·6 billion in 2016. Nonetheless, there is a great deal of variation revolving around these averages. 29 countries spend at least 50% more than expected per capita, based on their level of economic development alone, whereas 11 countries spend less than 50% their expected amount.
Health spending remains disparate, with low-income and lower-middle-income countries increasing spending in absolute terms the least, and relying heavily on OOP spending and development assistance. Moreover, tremendous variation shows that neither time nor economic development guarantee adequate prepaid health resources, which are vital for the pursuit of universal health coverage.
The Bill & Melinda Gates Foundation.
确保获得卫生服务并实现全民健康覆盖,需要有充足的预付卫生资源。此前关于全球卫生筹资的研究描述了经济发展与卫生筹资之间的关系。在本研究中,我们进一步探讨了全球卫生筹资趋势,并研究了随着经济发展,所使用的资金来源、购买的服务类型和用于发展援助的卫生支出是如何变化的。我们还确定了偏离这些趋势的国家。
我们根据包括方案报告、预算数据、国家估计数和 964 个国家卫生账户在内的各种数据,按护理类型和来源对国家卫生支出进行了估计,这些数据代表了 1995 年至 2014 年期间 184 个国家的卫生支出情况。我们将这些数据转换为一种通用的、经过通胀调整和购买力调整的货币,并使用非线性回归方法对卫生筹资、时间和经济发展之间的关系进行建模。
1995 年至 2014 年间,经济发展与总卫生支出呈正相关,对发展援助和自费(out-of-pocket,OOP)的依赖减少,转而更多地依赖政府支出。支出绝对增长最大的是高收入国家,按年增长率 3.0%计算,人均支出增至购买力调整后 5221 美元。增长最快的是中上收入(5.9%)和中下收入组(5.0%),每年的支出增长率都超过 5%,2014 年的人均支出分别为 914 美元和 267 美元。低收入国家的支出增长也相当快,为 4.6%,人均支出从 51 美元增加到 120 美元。2014 年,59.2%的卫生支出由政府提供资金,但在低收入和中下收入国家,29.1%和 58.0%的支出是自费支出,35.7%和 3.0%的支出是发展援助。发展援助卫生的最近增长较为温和;2010 年至 2016 年,每年增长 1.8%,2016 年达到 376 亿美元。尽管如此,这些平均值周围仍存在大量差异。29 个国家的人均支出比根据其经济发展水平单独预期的支出高出至少 50%,而 11 个国家的支出则不足预期的 50%。
卫生支出仍然存在差异,低收入和中下收入国家的支出绝对增长最少,而且严重依赖自费支出和发展援助。此外,巨大的差异表明,时间和经济发展都不能保证充足的预付卫生资源,而这对于实现全民健康覆盖至关重要。
比尔及梅琳达·盖茨基金会。