Lancet. 2018 May 5;391(10132):1799-1829. doi: 10.1016/S0140-6736(18)30698-6. Epub 2018 Apr 17.
Comparable estimates of health spending are crucial for the assessment of health systems and to optimally deploy health resources. The methods used to track health spending continue to evolve, but little is known about the distribution of spending across diseases. We developed improved estimates of health spending by source, including development assistance for health, and, for the first time, estimated HIV/AIDS spending on prevention and treatment and by source of funding, for 188 countries.
We collected published data on domestic health spending, from 1995 to 2015, from a diverse set of international agencies. We tracked development assistance for health from 1990 to 2017. We also extracted 5385 datapoints about HIV/AIDS spending, between 2000 and 2015, from online databases, country reports, and proposals submitted to multilateral organisations. We used spatiotemporal Gaussian process regression to generate complete and comparable estimates for health and HIV/AIDS spending. We report most estimates in 2017 purchasing-power parity-adjusted dollars and adjust all estimates for the effect of inflation.
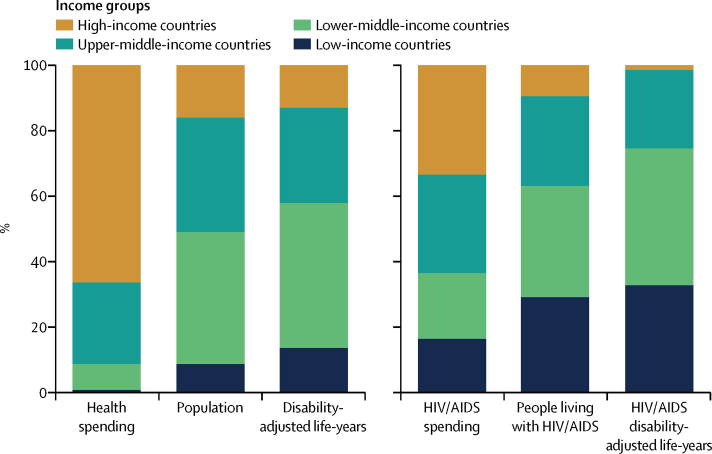
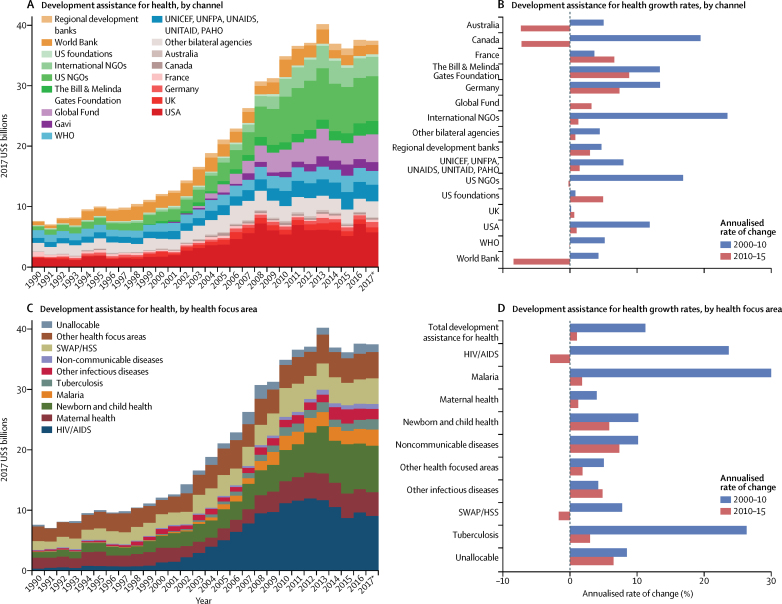
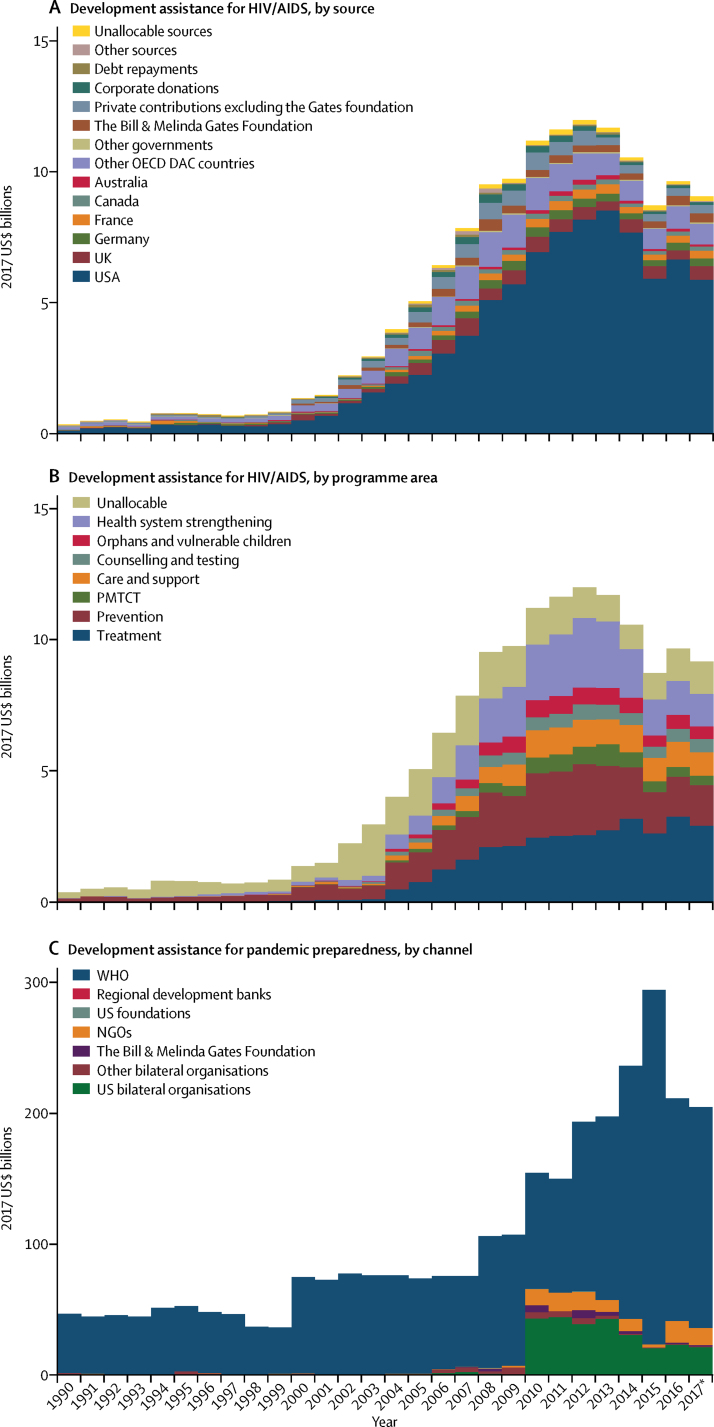
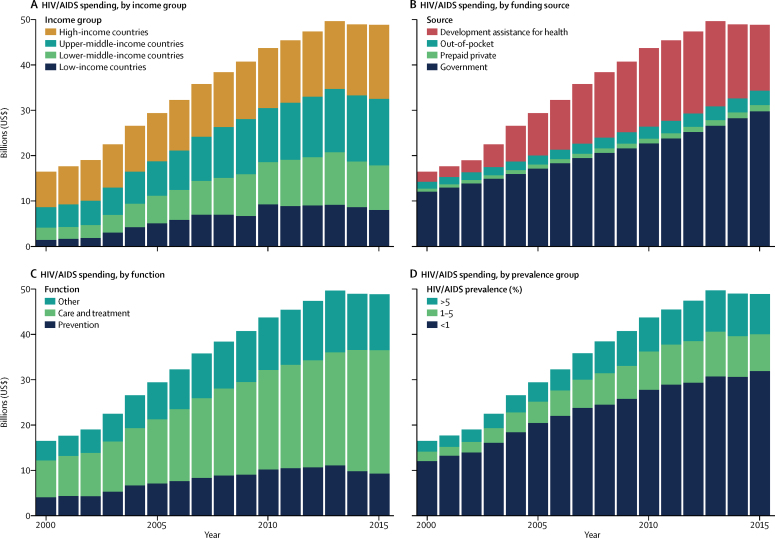
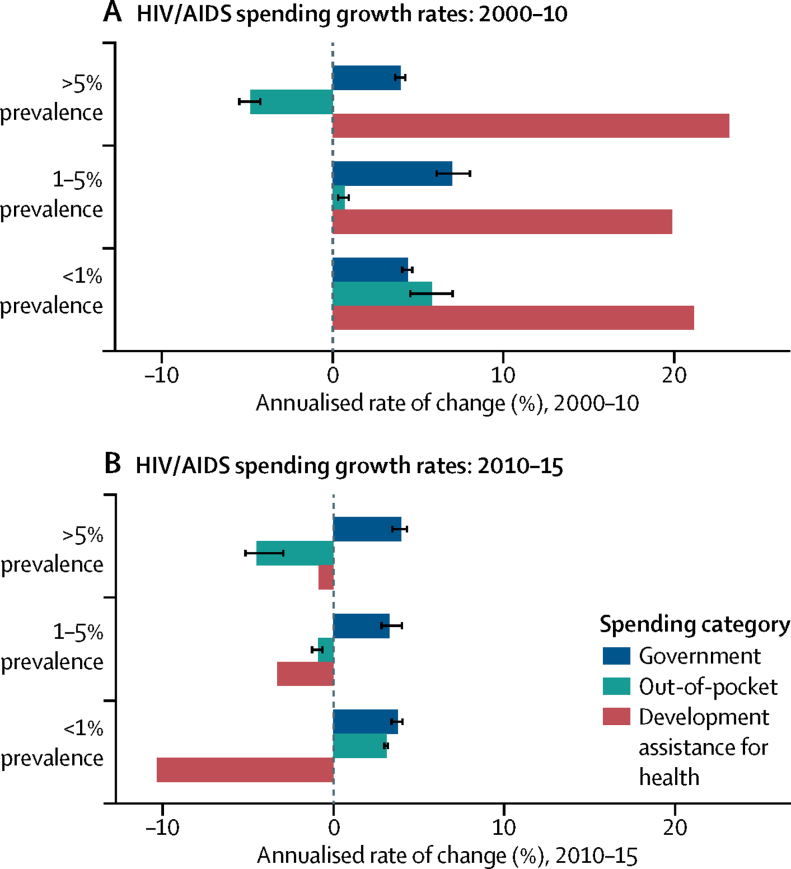
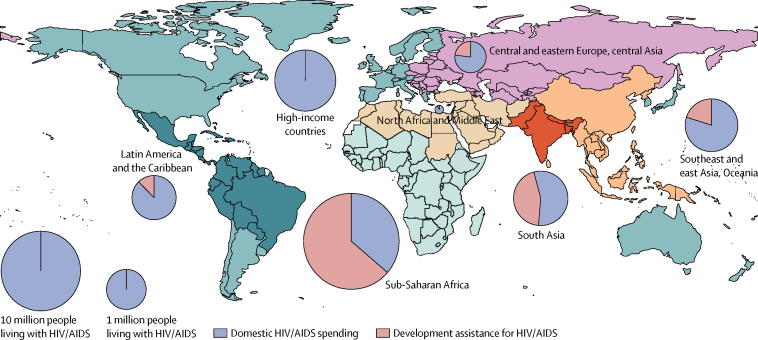
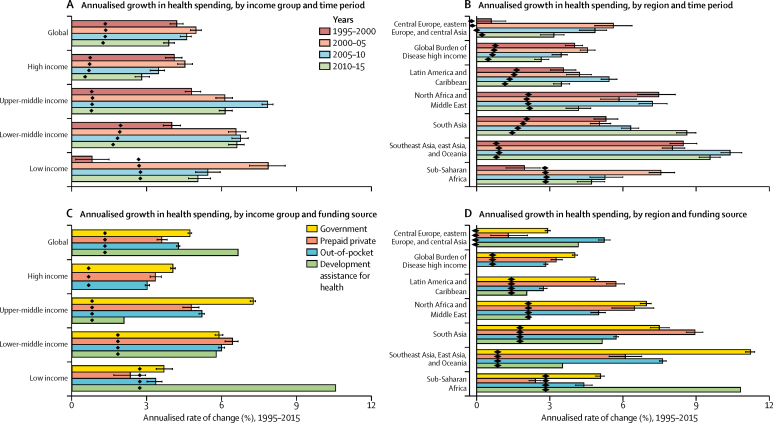
Between 1995 and 2015, global health spending per capita grew at an annualised rate of 3·1% (95% uncertainty interval [UI] 3·1 to 3·2), with growth being largest in upper-middle-income countries (5·4% per capita [UI 5·3-5·5]) and lower-middle-income countries (4·2% per capita [4·2-4·3]). In 2015, $9·7 trillion (9·7 trillion to 9·8 trillion) was spent on health worldwide. High-income countries spent $6·5 trillion (6·4 trillion to 6·5 trillion) or 66·3% (66·0 to 66·5) of the total in 2015, whereas low-income countries spent $70·3 billion (69·3 billion to 71·3 billion) or 0·7% (0·7 to 0·7). Between 1990 and 2017, development assistance for health increased by 394·7% ($29·9 billion), with an estimated $37·4 billion of development assistance being disbursed for health in 2017, of which $9·1 billion (24·2%) targeted HIV/AIDS. Between 2000 and 2015, $562·6 billion (531·1 billion to 621·9 billion) was spent on HIV/AIDS worldwide. Governments financed 57·6% (52·0 to 60·8) of that total. Global HIV/AIDS spending peaked at 49·7 billion (46·2-54·7) in 2013, decreasing to $48·9 billion (45·2 billion to 54·2 billion) in 2015. That year, low-income and lower-middle-income countries represented 74·6% of all HIV/AIDS disability-adjusted life-years, but just 36·6% (34·4 to 38·7) of total HIV/AIDS spending. In 2015, $9·3 billion (8·5 billion to 10·4 billion) or 19·0% (17·6 to 20·6) of HIV/AIDS financing was spent on prevention, and $27·3 billion (24·5 billion to 31·1 billion) or 55·8% (53·3 to 57·9) was dedicated to care and treatment.
From 1995 to 2015, total health spending increased worldwide, with the fastest per capita growth in middle-income countries. While these national disparities are relatively well known, low-income countries spent less per person on health and HIV/AIDS than did high-income and middle-income countries. Furthermore, declines in development assistance for health continue, including for HIV/AIDS. Additional cuts to development assistance could hasten this decline, and risk slowing progress towards global and national goals.
The Bill & Melinda Gates Foundation.
对于卫生系统的评估和最佳卫生资源配置来说,可比的卫生支出估算至关重要。跟踪卫生支出的方法在不断发展,但对疾病之间支出的分布情况了解甚少。我们开发了更精确的卫生支出估算,包括卫生发展援助,并首次按资金来源估算了 188 个国家艾滋病毒/艾滋病的预防和治疗支出。
我们从多个国际机构收集了 1995 年至 2015 年期间的国内卫生支出的已公布数据。我们跟踪了 1990 年至 2017 年的卫生发展援助情况。我们还从在线数据库、国家报告和提交给多边组织的提案中提取了 2000 年至 2015 年期间关于艾滋病毒/艾滋病支出的 5385 个数据点。我们使用时空高斯过程回归生成完整且可比的卫生和艾滋病毒/艾滋病支出估算。我们以购买力平价调整后的 2017 年美元报告大多数估计值,并对所有估计值进行通胀影响调整。
1995 年至 2015 年间,全球人均卫生支出以每年 3.1%(95%不确定性区间[UI]3.1-3.2)的速度增长,中高收入国家(人均增长 5.4%[UI 5.3-5.5])和中低收入国家(人均增长 4.2%[4.2-4.3])的增长幅度最大。2015 年,全球卫生支出为 9.7 万亿美元(9.7 万亿至 9.8 万亿美元)。高收入国家在 2015 年支出了 6.5 万亿美元(6.4 万亿至 6.5 万亿美元),占全球卫生总支出的 66.3%(66.0-66.5),而低收入国家仅支出了 703 亿美元(69.3 亿至 71.3 亿美元),占 0.7%(0.7-0.7)。1990 年至 2017 年,卫生发展援助增长了 394.7%(2990 亿美元),2017 年发展援助中有 3740 亿美元用于卫生,其中 910 亿美元(24.2%)用于艾滋病毒/艾滋病。2000 年至 2015 年,全球用于艾滋病毒/艾滋病的支出为 5626 亿美元(5311 亿至 6219 亿美元)。其中,政府资助了 57.6%(52.0-60.8)的支出。全球艾滋病毒/艾滋病支出在 2013 年达到峰值 497 亿美元(462-547 亿美元),随后在 2015 年下降至 489 亿美元(452 亿至 542 亿美元)。当年,低收入和中低收入国家占所有艾滋病毒/艾滋病伤残调整生命年的 74.6%,但仅占艾滋病毒/艾滋病总支出的 36.6%(34.4-38.7)。2015 年,93 亿美元(85 亿至 104 亿美元)或 19.0%(17.6-20.6)的艾滋病毒/艾滋病资金用于预防,273 亿美元(245 亿至 311 亿美元)或 55.8%(53.3-57.9)用于护理和治疗。
从 1995 年至 2015 年,全球卫生支出增加,中低收入国家的人均增长最快。虽然这些国家间的差异相对较为人知,但低收入国家的人均卫生支出和艾滋病毒/艾滋病支出低于高收入和中高收入国家。此外,卫生发展援助继续减少,包括艾滋病毒/艾滋病援助。进一步削减发展援助可能会加速这一下降,并有可能减缓全球和国家目标的进展。
比尔及梅林达·盖茨基金会。