Dombernowsky Tilde, Hædersdal Merete, Lassen Ulrik, Thomsen Simon Francis
Department of Dermatology, Copenhagen University Hospital Bispebjerg, Copenhagen, Denmark.
Department of Oncology, Copenhagen University Hospital Rigshospitalet, Copenhagen, Denmark.
BMJ Open. 2017 Jul 10;7(7):e015579. doi: 10.1136/bmjopen-2016-015579.
To investigate the development in the number of applications for authorisation of clinical trials of medicines (CTAs) submitted annually to national competent authorities in 10 Western European member states of the European Union from 2007 to 2015.
Registry study.
Data from national competent authorities.
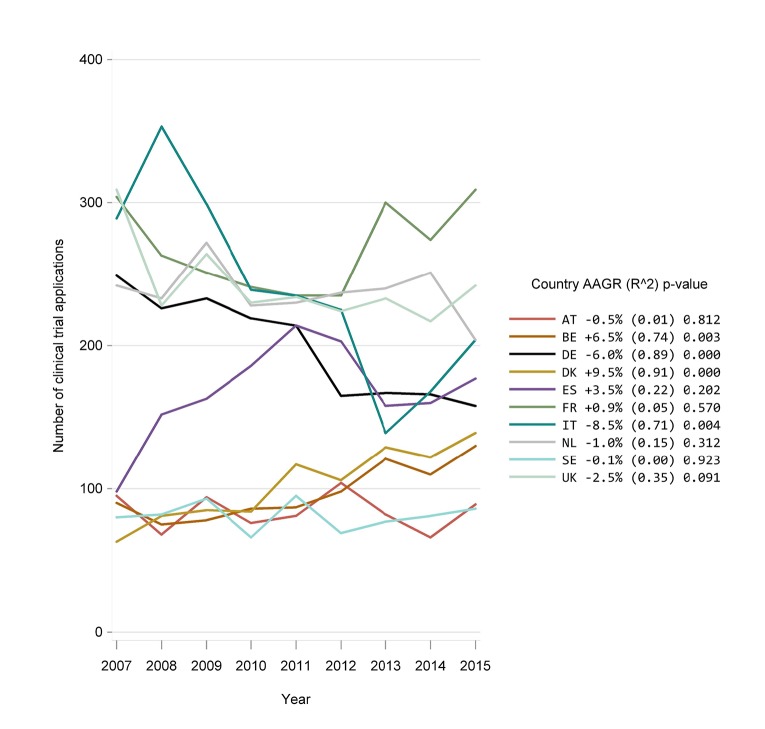
Germany, Italy, Spain, France, the UK, Belgium, the Netherlands, Austria, Denmark and Sweden. Inclusion criteria were Western European member states of the European Union, receiving more than 200 CTAs per year.
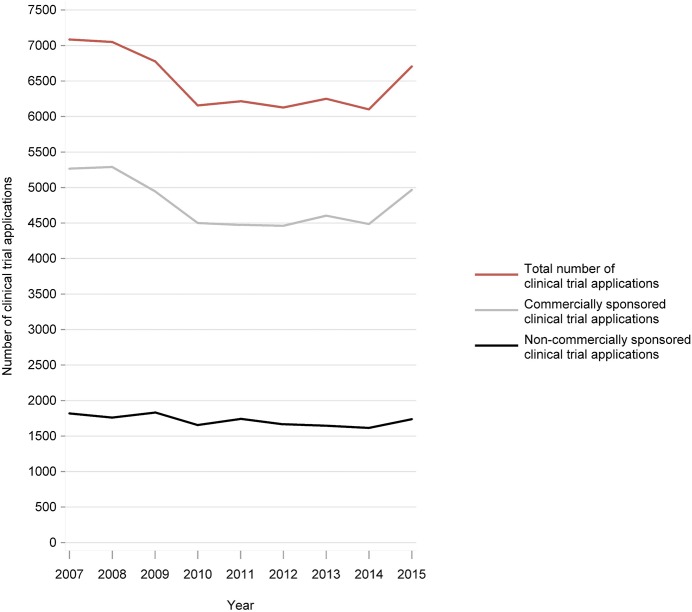
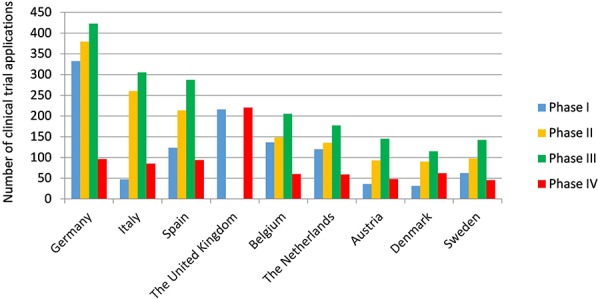
Summarised number of CTAs and distribution of CTAs by type of sponsor (commercial or non-commercial) and trial phase (I-IV). Average annual growth rates (AAGRs) based on linear regressions. Data were evaluated 2007-2011 and 2012-2015 to compare findings with the European Commission's statement of a 25% decrease in CTAs in the EU from 2007 to 2011.
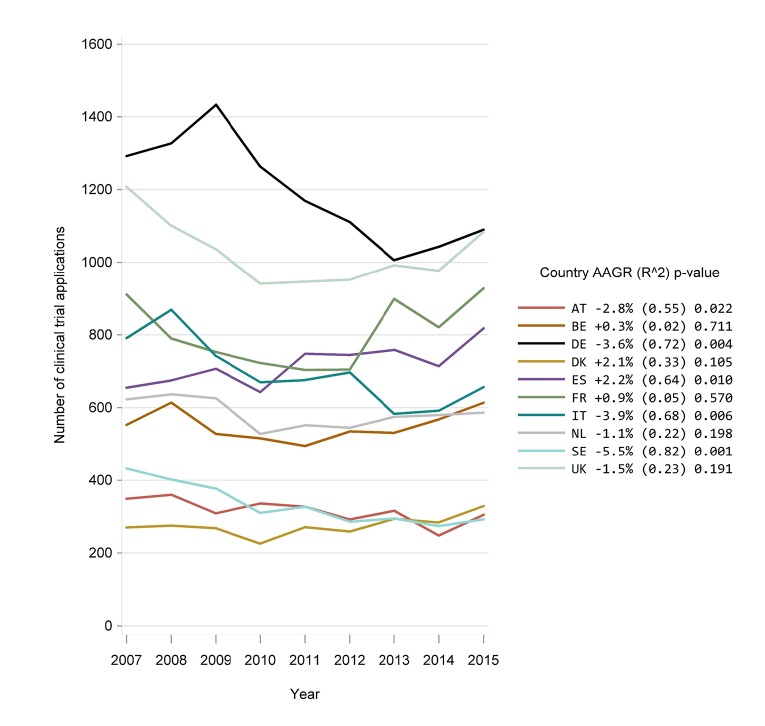
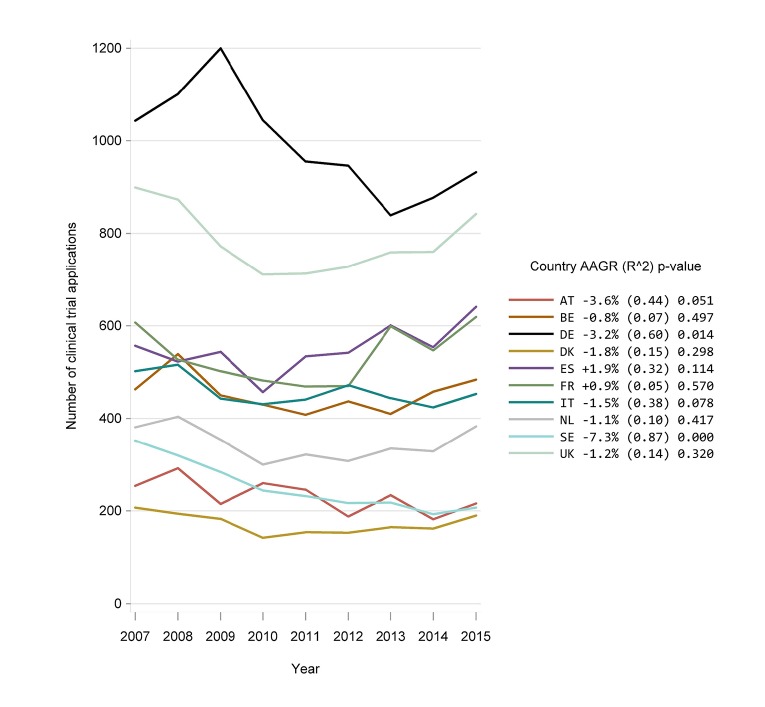
From 2007 to 2011, the summarised number of CTAs decreased significantly (AAGR -3.9% (p=0.02)), primarily due to a decrease in commercially sponsored CTAs. From 2012 to 2015, the change was insignificant (AAGR 2.6% (p=0.27)), however with a 10% increase from 2014 to 2015 after stagnation from 2012 to 2014. Overall, the number of CTAs and distribution by type of sponsor varied considerably between countries. No distinct trends were observed when evaluating CTAs by type of trial phase.
This study found a significant decrease in the number of CTAs in Western Europe from 2007 to 2011 (AAGR -3.9%). This development is possibly attributable to several factors such as the European Clinical Trials Directive, national and local political decisions, and a potential global shift in clinical trial activity. From 2014 to 2015, the number of CTAs increased markedly (10%). However, it is yet too soon to determine if this constitutes a transient fluctuation or a new trend.
调查2007年至2015年期间,欧盟10个西欧成员国每年向国家主管部门提交的药品临床试验申请(CTA)数量的变化情况。
注册研究。
来自国家主管部门的数据。
德国、意大利、西班牙、法国、英国、比利时、荷兰、奥地利、丹麦和瑞典。纳入标准为欧盟的西欧成员国,每年接收超过200份CTA。
CTA的汇总数量,以及按申办方类型(商业或非商业)和试验阶段(I-IV期)划分的CTA分布情况。基于线性回归的年均增长率(AAGR)。对2007-2011年和2012-2015年的数据进行评估,以便将研究结果与欧盟委员会关于2007年至2011年欧盟CTA数量下降25%的声明进行比较。
2007年至2011年,CTA的汇总数量显著下降(AAGR -3.9%,p=0.02),主要原因是商业申办的CTA数量减少。2012年至2015年,变化不显著(AAGR 2.6%,p=0.27),不过在2012年至2014年停滞之后,2014年至2015年有10%的增长。总体而言,CTA的数量以及按申办方类型划分的分布在各国之间差异很大。按试验阶段类型评估CTA时未观察到明显趋势。
本研究发现2007年至2011年西欧CTA数量显著下降(AAGR -3.9%)。这种变化可能归因于多种因素,如《欧洲临床试验指令》、国家和地方的政治决策,以及临床试验活动潜在的全球转移。2014年至2015年,CTA数量显著增加(10%)。然而,现在判断这是暂时波动还是新趋势还为时过早。