Research Department of Epidemiology and Public Health, University College London, London, UK.
MRC Epidemiology Unit and Centre for Diet and Activity Research (CEDAR), University of Cambridge School of Clinical Medicine, Cambridge, UK.
Addiction. 2018 Jan;113(1):34-43. doi: 10.1111/add.13949. Epub 2017 Aug 24.
Studies that report the relationship between alcohol consumption and disease risk have predominantly operationalized drinking according to a single baseline measure. The resulting assumption of longitudinal stability may be simplistic and complicate interpretation of risk estimates. This study aims to describe changes to the volume of consumption during the adult life-course according to baseline categories of drinking.
A prospective observational study.
United Kingdom.
A cohort of British civil servants totalling 6838 men and 3372 women aged 34-55 years at baseline, followed for a mean 19.1 (standard deviation = 9.5) years.
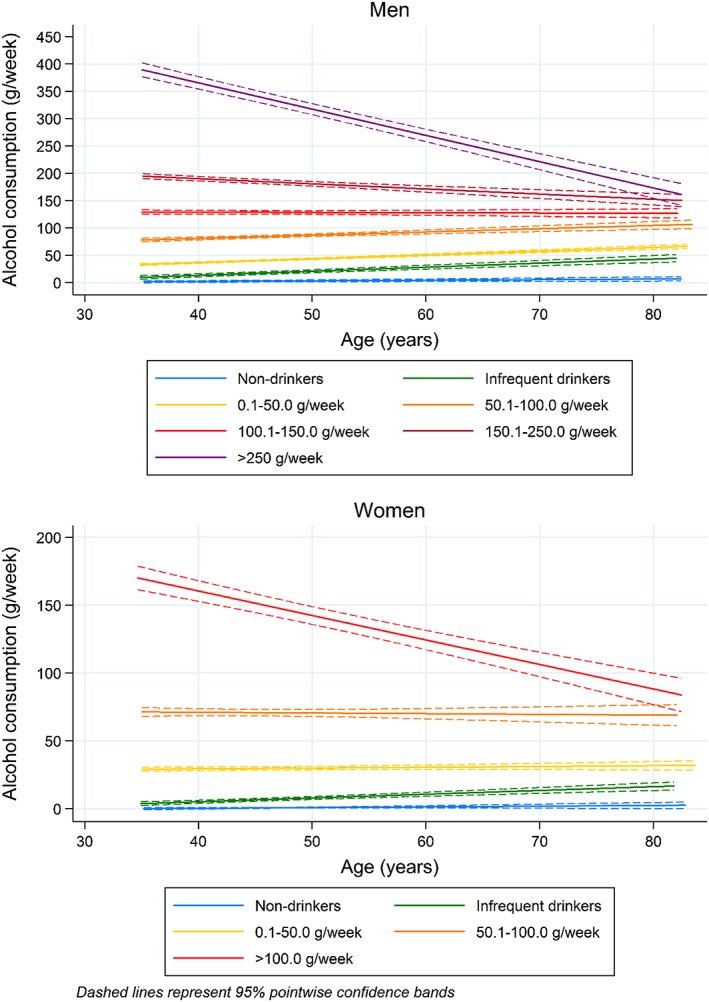
The volume of weekly alcohol consumption was estimated from data concerning the frequency and number of drinks consumed. Baseline categories were defined: non-current drinkers, infrequent drinkers, 0.1-50.0 g/week, 50.1-100.0 g/week, 100.1-150.0 g/week, 150.1-250.0 g/week and >250.0 g/week. For women, the highest category was defined as > 100.0 g/week. Baseline frequency was derived as 'daily or almost daily' and 'not daily or almost daily'. Trajectories were estimated within baseline categories using growth curve models.
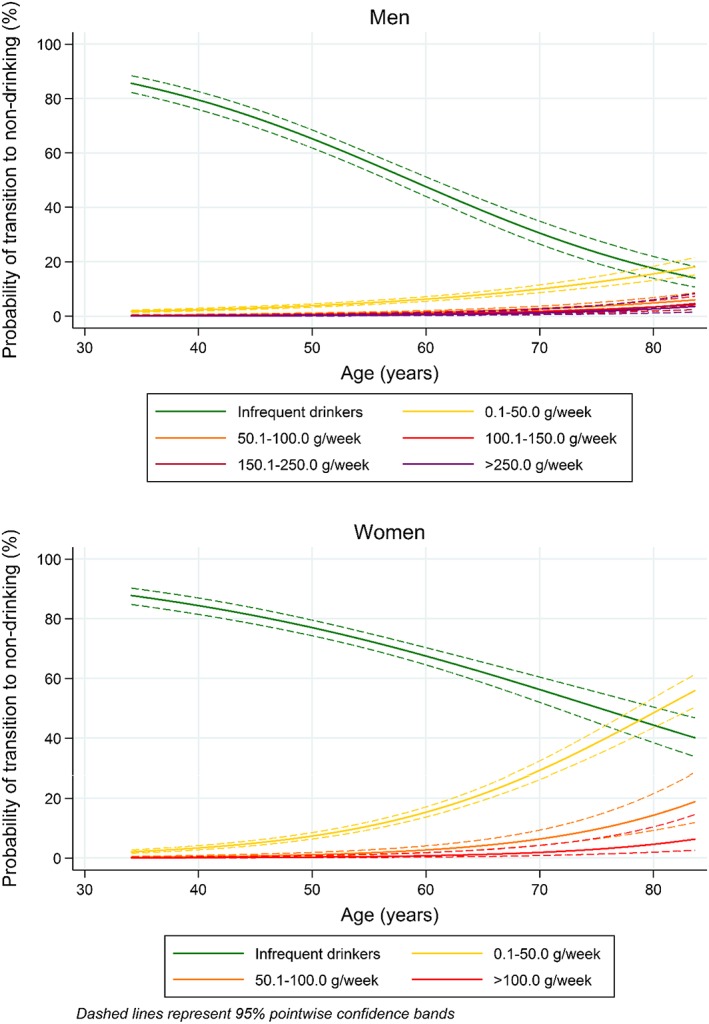
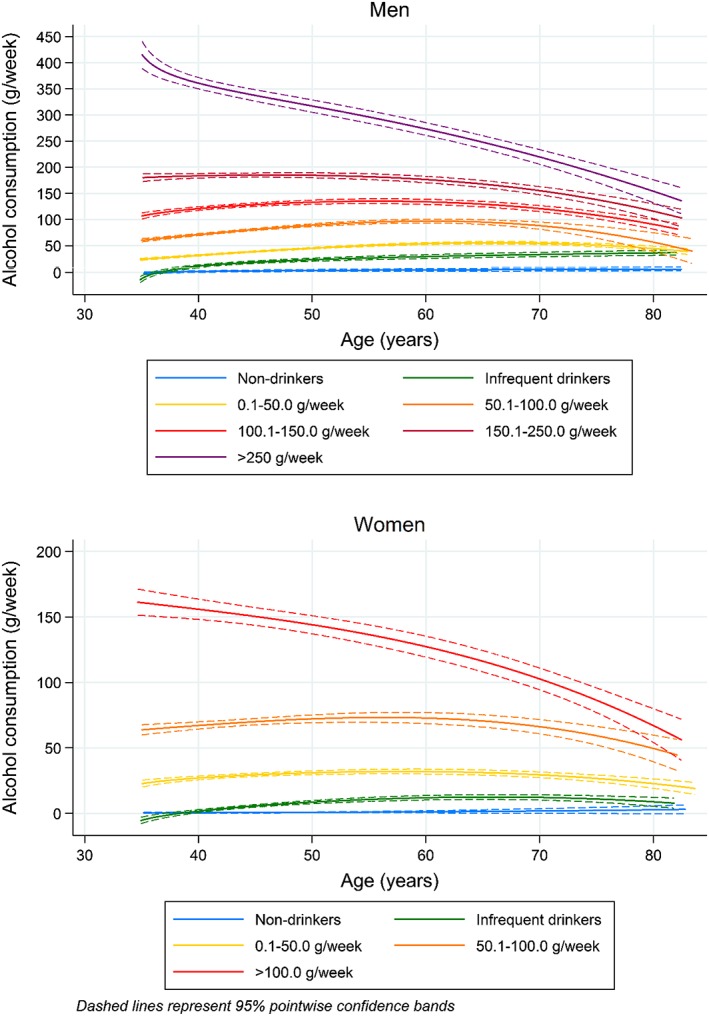
Trajectories differed between men and women, but were relatively stable within light-to-moderate categories of baseline consumption. Drinking was least stable within the highest categories of baseline consumption (men: > 250.0 g/week; women: > 100.0 g/week), declining by 47.0 [95% confidence interval (CI) = 40.7, 53.2] and 16.8 g/week (95% CI = 12.6, 21.0), respectively, per 10-year increase in age. These declines were not a consequence of sudden transitions to complete abstention. Rates of decline appear greatest in older age, with trajectories converging toward moderate volumes.
Among UK civil servants, consumption within baseline drinking categories is generally stable during the life-course, except among heavier baseline drinkers, for whom intakes decline with increasing age. This shift does not appear to be driven by transitions to non-drinking. Cohorts of older people may be at particular risk of misclassifying former heavy drinkers as moderate consumers of alcohol.
报告饮酒与疾病风险之间关系的研究主要根据单一基线测量来操作饮酒。由此产生的纵向稳定性假设可能过于简单化,并使风险估计的解释复杂化。本研究旨在根据基线饮酒类别描述成年期内饮酒量的变化。
前瞻性观察性研究。
英国。
共纳入 6838 名男性和 3372 名女性英国公务员,他们在基线时年龄为 34-55 岁,平均随访 19.1 年(标准差=9.5)。
每周饮酒量的估计值来自于有关饮酒频率和饮酒量的数据。基线类别定义为:非当前饮酒者、不频繁饮酒者、每周 0.1-50.0g、每周 50.1-100.0g、每周 100.1-150.0g、每周 150.1-250.0g 和每周 >250.0g。对于女性,最高类别定义为每周>100.0g。基线频率来自于“每日或几乎每日”和“非每日或几乎每日”。使用增长曲线模型在基线类别内估计轨迹。
男性和女性之间的轨迹不同,但在轻至中度基线饮酒类别内相对稳定。在最高的基线饮酒类别内,饮酒最不稳定(男性:每周>250.0g;女性:每周>100.0g),随着年龄每增加 10 岁,分别下降 47.0g(95%置信区间[CI]为 40.7, 53.2)和 16.8g(95%CI为 12.6, 21.0)。这些下降并不是突然过渡到完全戒酒的结果。下降速度似乎在老年时最大,轨迹逐渐收敛到中等量。
在英国公务员中,除了基线饮酒量较高的人群外,在整个生命周期中,基线饮酒类别内的饮酒量通常是稳定的,对于这些人群,随着年龄的增长,摄入量会下降。这种变化似乎不是由过渡到不饮酒引起的。年龄较大的人群可能特别容易将以前的重度饮酒者错误归类为酒精的中度消费者。