• 文献检索
  • 文档翻译
  • 深度研究
  • 学术资讯
  • Suppr Zotero 插件Zotero 插件
  • 邀请有礼
  • 套餐&价格
  • 历史记录
应用&插件
Suppr Zotero 插件Zotero 插件浏览器插件Mac 客户端Windows 客户端微信小程序
定价
高级版会员购买积分包购买API积分包
服务
文献检索文档翻译深度研究API 文档MCP 服务
关于我们
关于 Suppr公司介绍联系我们用户协议隐私条款
关注我们

Suppr 超能文献

核心技术专利:CN118964589B侵权必究
粤ICP备2023148730 号-1Suppr @ 2026

文献检索

告别复杂PubMed语法,用中文像聊天一样搜索,搜遍4000万医学文献。AI智能推荐,让科研检索更轻松。

立即免费搜索

文件翻译

保留排版,准确专业,支持PDF/Word/PPT等文件格式,支持 12+语言互译。

免费翻译文档

深度研究

AI帮你快速写综述,25分钟生成高质量综述,智能提取关键信息,辅助科研写作。

立即免费体验

2015 年美国预期寿命为何下降?一项性别特异性分析。

Why did life expectancy decline in the United States in 2015? A gender-specific analysis.

机构信息

The Pennsylvania State University, USA.

The Pennsylvania State University, USA.

出版信息

Soc Sci Med. 2017 Oct;190:174-180. doi: 10.1016/j.socscimed.2017.08.004. Epub 2017 Aug 8.

DOI:10.1016/j.socscimed.2017.08.004
PMID:28865253
原文链接:https://pmc.ncbi.nlm.nih.gov/articles/PMC5611857/
Abstract

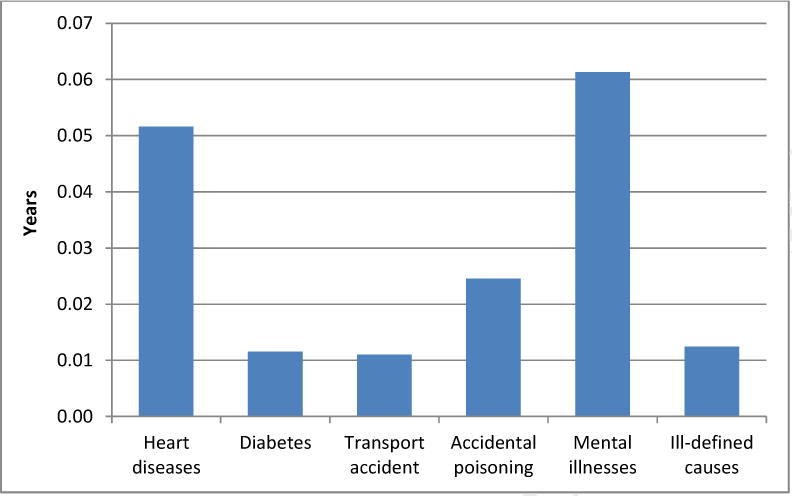
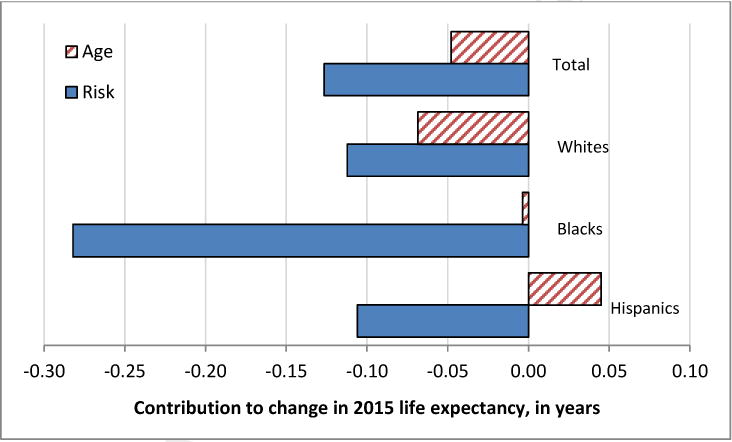
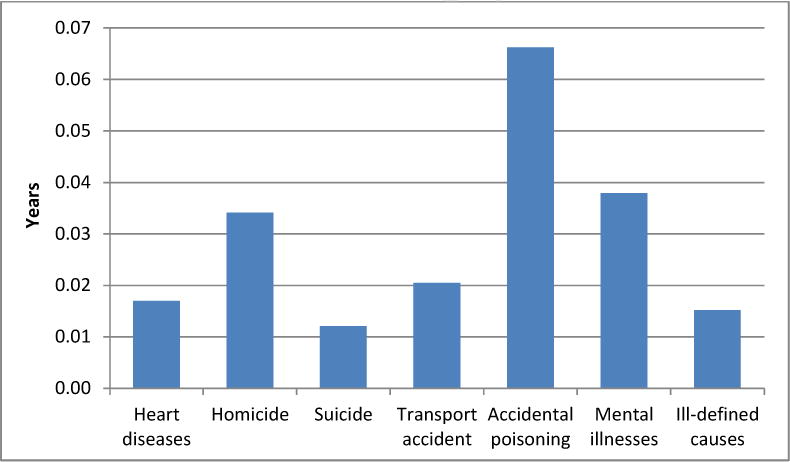
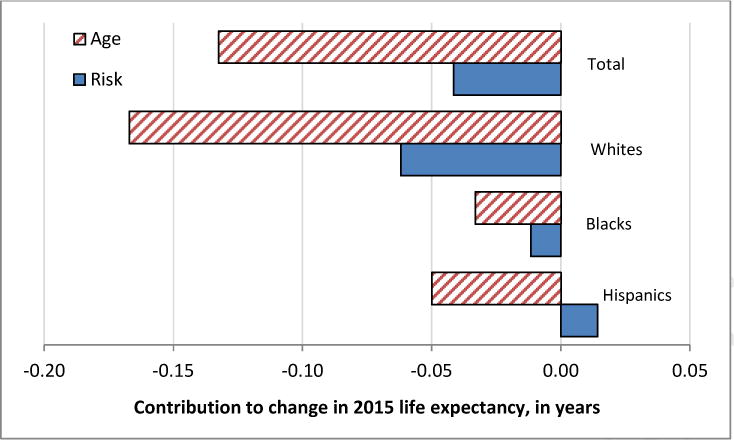
In 2015, age-adjusted mortality rates increased for 8 of the 10 leading causes of death in the United States. As a result, life expectancy declined by 0.17 years for both women and men. The decline could be just an anomaly, or it could represent the start of a new trend of stagnation or decline in life expectancy, as some scholars have warned. The first step is to determine the sources of the decline. In this study we analyze the contribution of specific causes of death to the decline in men's versus women's life expectancy, as well as the mechanisms that generated the decline. With regard to mechanisms, we examine whether the decline in life expectancy resulted from reductions in the average age at death for most causes of death, or from a greater risk of dying of causes that disproportionately affect the young and middle-aged. Using CDC mortality data, we construct life tables for men and women separately, based on 20 different underlying causes of death. We find that men's reduction in life expectancy was attributable primarily to changes in midlife mortality, with a greater risk of dying of causes such as accidental poisoning or homicide. The reduction in women's life expectancy, on the other hand, was attributable primarily to changes in old-age mortality, where the mean age at death for most causes (such as heart disease and mental illnesses) was lower in 2015 than it was in 2014. These gender-specific mechanisms that contributed to the decline in life expectancy are common to the major racial/ethnic groups, but the magnitude of the decline differs greatly across racial/ethnic groups. Future research can use the tools provided here to investigate in more detail how the gender-specific mechanisms of the 2015 decline differ by race.

摘要

2015 年,美国十大主要死因中有 8 种的年龄调整死亡率上升。因此,男性和女性的预期寿命均下降了 0.17 年。这一下降可能只是一个异常现象,也可能代表着预期寿命停滞或下降的新趋势的开始,正如一些学者所警告的那样。第一步是确定下降的原因。在这项研究中,我们分析了导致男性和女性预期寿命下降的特定死因的贡献,以及导致下降的机制。关于机制,我们研究了预期寿命的下降是否是由于大多数死因的死亡平均年龄降低所致,还是由于年轻人和中年人更容易死于某些不成比例影响他们的原因所致。我们使用疾病预防控制中心的死亡率数据,根据 20 种不同的根本死因,分别为男性和女性构建生命表。我们发现,男性预期寿命的缩短主要归因于中年死亡率的变化,死于意外中毒或杀人等原因的风险更大。另一方面,女性预期寿命的缩短主要归因于老年死亡率的变化,2015 年大多数死因(如心脏病和精神疾病)的平均死亡年龄低于 2014 年。导致预期寿命下降的这些性别特定机制在主要种族/族裔群体中是共同的,但下降的幅度在不同种族/族裔群体中差异很大。未来的研究可以使用这里提供的工具更详细地研究 2015 年下降的性别特定机制在不同种族之间的差异。

https://cdn.ncbi.nlm.nih.gov/pmc/blobs/d4bb/5611857/8461387d68f2/nihms903184f4.jpg
https://cdn.ncbi.nlm.nih.gov/pmc/blobs/d4bb/5611857/0f9f4d691fc3/nihms903184f1.jpg
https://cdn.ncbi.nlm.nih.gov/pmc/blobs/d4bb/5611857/2aa736a31a71/nihms903184f2.jpg
https://cdn.ncbi.nlm.nih.gov/pmc/blobs/d4bb/5611857/afd4ea3d1cf4/nihms903184f3.jpg
https://cdn.ncbi.nlm.nih.gov/pmc/blobs/d4bb/5611857/8461387d68f2/nihms903184f4.jpg

相似文献

1
Why did life expectancy decline in the United States in 2015? A gender-specific analysis.2015 年美国预期寿命为何下降?一项性别特异性分析。
Soc Sci Med. 2017 Oct;190:174-180. doi: 10.1016/j.socscimed.2017.08.004. Epub 2017 Aug 8.
2
Global, regional, and national life expectancy, all-cause mortality, and cause-specific mortality for 249 causes of death, 1980-2015: a systematic analysis for the Global Burden of Disease Study 2015.1980 - 2015年全球、区域和国家249种死因的预期寿命、全死因死亡率和死因别死亡率:全球疾病负担研究2015的系统分析
Lancet. 2016 Oct 8;388(10053):1459-1544. doi: 10.1016/S0140-6736(16)31012-1.
3
The effect of revised populations on mortality statistics for the United States, 2000.2000年美国人口修订对死亡率统计数据的影响。
Natl Vital Stat Rep. 2003 Jun 5;51(9):1-24.
4
CDC National Health Report: leading causes of morbidity and mortality and associated behavioral risk and protective factors--United States, 2005-2013.美国疾病控制与预防中心国家健康报告:2005 - 2013年美国发病和死亡的主要原因以及相关行为风险和保护因素
MMWR Suppl. 2014 Oct 31;63(4):3-27.
5
Causes of declining life expectancy in Russia.俄罗斯人均预期寿命下降的原因。
JAMA. 1998 Mar 11;279(10):793-800. doi: 10.1001/jama.279.10.793.
6
Global, regional, and national age-sex specific all-cause and cause-specific mortality for 240 causes of death, 1990-2013: a systematic analysis for the Global Burden of Disease Study 2013.全球、地区和国家按年龄、性别划分的 240 种死因的全死因和特定死因死亡率,1990-2013 年:2013 年全球疾病负担研究的系统分析。
Lancet. 2015 Jan 10;385(9963):117-71. doi: 10.1016/S0140-6736(14)61682-2. Epub 2014 Dec 18.
7
The reversal of fortunes: trends in county mortality and cross-county mortality disparities in the United States.命运的逆转:美国各县死亡率趋势及县际死亡率差异
PLoS Med. 2008 Apr 22;5(4):e66. doi: 10.1371/journal.pmed.0050066.
8
Global burden of 288 causes of death and life expectancy decomposition in 204 countries and territories and 811 subnational locations, 1990-2021: a systematic analysis for the Global Burden of Disease Study 2021.全球 204 个国家和地区及 811 个亚级行政区 1990 年至 2021 年 288 种死因及预期寿命的归因分析:全球疾病负担研究 2021 系统分析。
Lancet. 2024 May 18;403(10440):2100-2132. doi: 10.1016/S0140-6736(24)00367-2. Epub 2024 Apr 3.
9
Alternative projections of mortality and disability by cause 1990-2020: Global Burden of Disease Study.1990 - 2020年按病因划分的死亡率和残疾率的替代预测:全球疾病负担研究
Lancet. 1997 May 24;349(9064):1498-504. doi: 10.1016/S0140-6736(96)07492-2.
10
Changing mortality patterns in East and West Germany and Poland. II: short-term trends during transition and in the 1990s.东德、西德和波兰死亡率模式的变化。II:转型期间及20世纪90年代的短期趋势。
J Epidemiol Community Health. 2000 Dec;54(12):899-906. doi: 10.1136/jech.54.12.899.

引用本文的文献

1
Demographic and regional trends of pneumonia mortality in the United States, 1999 to 2022.1999年至2022年美国肺炎死亡率的人口统计学和地区趋势
Sci Rep. 2025 Mar 24;15(1):10103. doi: 10.1038/s41598-025-94715-6.
2
Sexual and gender identities and alcohol use during the COVID-19 pandemic.在 COVID-19 大流行期间的性与性别认同和饮酒行为。
PLoS One. 2024 Sep 6;19(9):e0308925. doi: 10.1371/journal.pone.0308925. eCollection 2024.
3
Estimates of excess mortality during the COVID-19 pandemic strongly depend on subjective methodological choices.

本文引用的文献

1
Mortality from Suicide, Chronic Liver Disease, and Drug Poisonings among Middle-Aged U.S. White Men and Women, 1980-2013.1980 - 2013年美国中年白人男性和女性自杀、慢性肝病及药物中毒所致死亡率
Biodemography Soc Biol. 2017;63(1):31-37. doi: 10.1080/19485565.2016.1248892.
2
Mortality in the United States, 2015.美国2015年的死亡率。
NCHS Data Brief. 2016 Dec(267):1-8.
3
Deaths: Leading Causes for 2014.死亡:2014年的主要死因。
新冠大流行期间超额死亡率的估计值在很大程度上取决于主观的方法选择。
Herz. 2023 Jun;48(3):180-183. doi: 10.1007/s00059-023-05166-6. Epub 2023 May 4.
4
Declining life expectancy in the Great Lakes region: contributors to Black and white longevity change across educational attainment.大湖区预期寿命下降:受教育程度对黑人和白人寿命变化的影响因素。
BMC Public Health. 2023 Apr 26;23(1):769. doi: 10.1186/s12889-023-15668-x.
5
Cause-Specific Mortality and Racial Differentials in Life Expectancy, Chicago 2018-2019.2018-2019 年芝加哥特定病因死亡率与预期寿命的种族差异。
J Racial Ethn Health Disparities. 2024 Apr;11(2):846-852. doi: 10.1007/s40615-023-01566-w. Epub 2023 Mar 27.
6
Developing explanatory models for life course shifts in the burden of substance use to inform future policy and practice.为了为物质使用负担在生命历程中的变化提供解释模型,以告知未来的政策和实践。
Int J Drug Policy. 2021 Aug;94:103182. doi: 10.1016/j.drugpo.2021.103182. Epub 2021 Mar 6.
7
Comparison of All-Cause Mortality Rates and Inequities Between Black and White Populations Across the 30 Most Populous US Cities.比较美国 30 个人口最多城市的黑人和白人的全因死亡率和不公平现象。
JAMA Netw Open. 2021 Jan 4;4(1):e2032086. doi: 10.1001/jamanetworkopen.2020.32086.
8
How have changes in death by cause and age group contributed to the recent stalling of life expectancy gains in Scotland? Comparative decomposition analysis of mortality data, 2000-2002 to 2015-2017.按死因和年龄组划分的死亡变化如何导致了近期苏格兰预期寿命增长的停滞?2000 - 2002年至2015 - 2017年死亡率数据的比较分解分析。
BMJ Open. 2020 Oct 7;10(10):e036529. doi: 10.1136/bmjopen-2019-036529.
9
Relationships between best-practice and greatest possible life expectancies.最佳实践与最大可能预期寿命之间的关系。
Eur J Ageing. 2019 Dec 14;17(3):331-339. doi: 10.1007/s10433-019-00549-3. eCollection 2020 Sep.
10
Current and future trends in men's health clinics.男性健康诊所的当前及未来趋势。
Transl Androl Urol. 2020 Mar;9(Suppl 2):S116-S122. doi: 10.21037/tau.2019.08.33.
Natl Vital Stat Rep. 2016 Jun;65(5):1-96.
4
Lifespan Weighed Down by Diet.饮食拖累寿命。
JAMA. 2016 Jun 7;315(21):2269-70. doi: 10.1001/jama.2016.3829.
5
Rising morbidity and mortality in midlife among white non-Hispanic Americans in the 21st century.21世纪美国非西班牙裔白人中年人群中发病率和死亡率的上升。
Proc Natl Acad Sci U S A. 2015 Dec 8;112(49):15078-83. doi: 10.1073/pnas.1518393112. Epub 2015 Nov 2.
6
Pinpointing the sources of the Asian mortality advantage in the USA.找出美国亚洲人死亡率优势的来源。
J Epidemiol Community Health. 2015 Oct;69(10):1006-11. doi: 10.1136/jech-2015-205623. Epub 2015 Jun 1.
7
Why the racial gap in life expectancy is declining in the United States.为何美国预期寿命方面的种族差距正在缩小。
Demogr Res. 2014 Oct 30;31:975-1006. doi: 10.4054/DemRes.2014.31.32.
8
Forecasting the effects of obesity and smoking on U.S. life expectancy.预测肥胖和吸烟对美国预期寿命的影响。
N Engl J Med. 2009 Dec 3;361(23):2252-60. doi: 10.1056/NEJMsa0900459.
9
A potential decline in life expectancy in the United States in the 21st century.21世纪美国预期寿命可能下降。
N Engl J Med. 2005 Mar 17;352(11):1138-45. doi: 10.1056/NEJMsr043743.
10
Demography. Broken limits to life expectancy.人口统计学。预期寿命突破极限。
Science. 2002 May 10;296(5570):1029-31. doi: 10.1126/science.1069675.