Hugo Sanet, Altwegg Res
South African Institute for Aquatic Biodiversity Grahamstown South Africa.
Centre for Statistics in Ecology, Environment and Conservation Department of Statistical Sciences University of Cape Town Rondebosch South Africa.
Ecol Evol. 2017 Jul 27;7(17):6839-6849. doi: 10.1002/ece3.3228. eCollection 2017 Sep.
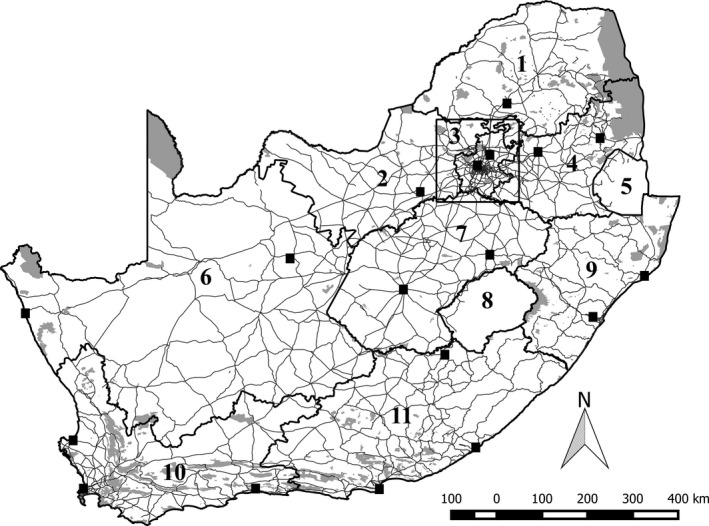
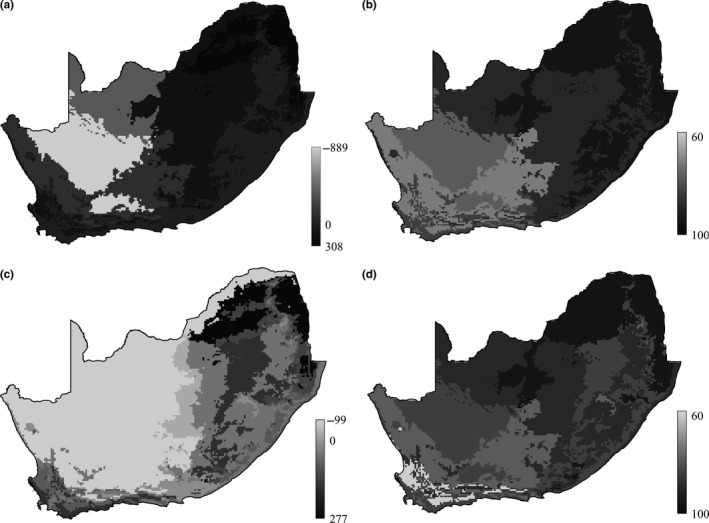
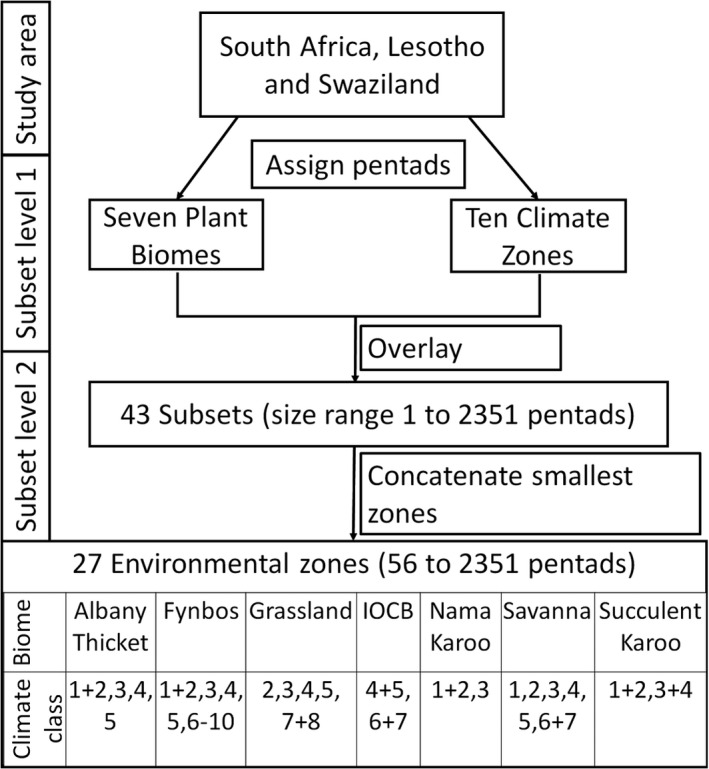
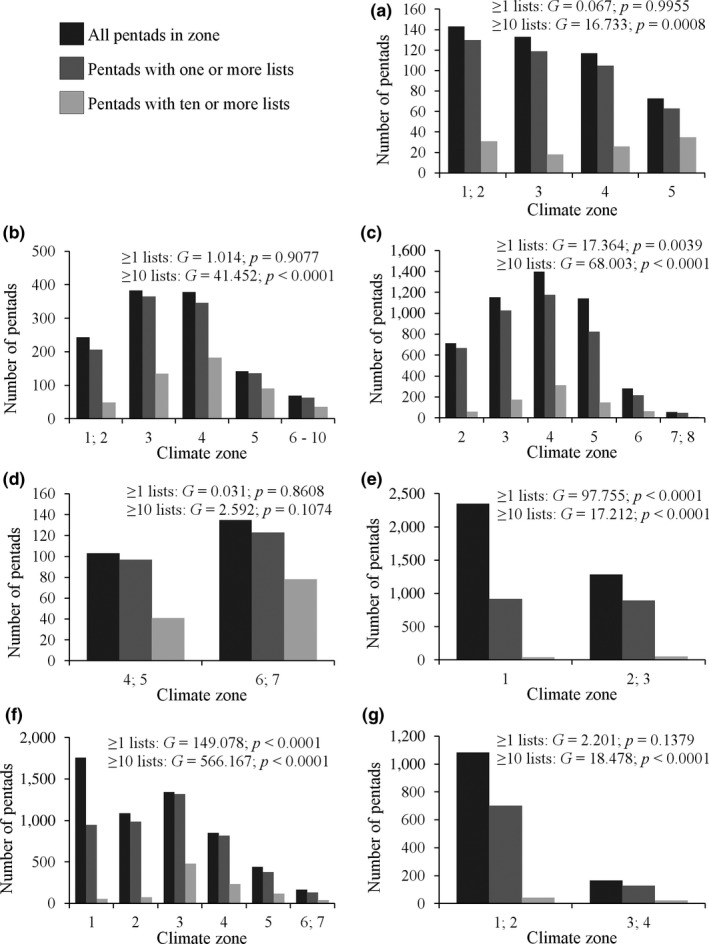
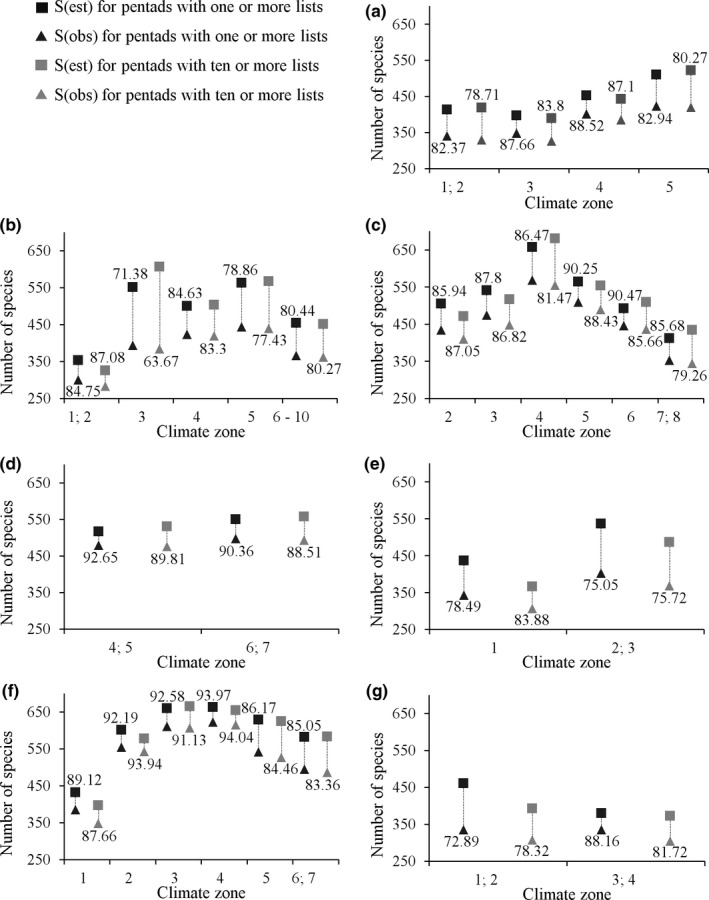
Using the Southern African Bird Atlas Project (SABAP2) as a case study, we examine the possible determinants of spatial bias in volunteer sampling effort and how well such biased data represent environmental gradients across the area covered by the atlas. For each province in South Africa, we used generalized linear mixed models to determine the combination of variables that explain spatial variation in sampling effort (number of visits per 5' × 5' grid cell, or "pentad"). The explanatory variables were distance to major road and exceptional birding locations or "sampling hubs," percentage cover of protected, urban, and cultivated area, and the climate variables mean annual precipitation, winter temperatures, and summer temperatures. Further, we used the climate variables and plant biomes to define subsets of pentads representing environmental zones across South Africa, Lesotho, and Swaziland. For each environmental zone, we quantified sampling intensity, and we assessed sampling completeness with species accumulation curves fitted to the asymptotic Lomolino model. Sampling effort was highest close to sampling hubs, major roads, urban areas, and protected areas. Cultivated area and the climate variables were less important. Further, environmental zones were not evenly represented by current data and the zones varied in the amount of sampling required representing the species that are present. SABAP2 volunteers' preferences in birding locations cause spatial bias in the dataset that should be taken into account when analyzing these data. Large parts of South Africa remain underrepresented, which may restrict the kind of ecological questions that may be addressed. However, sampling bias may be improved by directing volunteers toward undersampled regions while taking into account volunteer preferences.
以南部非洲鸟类地图集项目(SABAP2)为例,我们研究了志愿者抽样工作中空间偏差的可能决定因素,以及此类有偏差的数据在多大程度上能够代表地图集覆盖区域内的环境梯度。对于南非的每个省份,我们使用广义线性混合模型来确定能够解释抽样工作空间变化(每5'×5'网格单元或“五分格”的访问次数)的变量组合。解释变量包括到主要道路和特殊观鸟地点或“抽样中心”的距离、保护区、城市和耕地的覆盖百分比,以及气候变量年平均降水量、冬季温度和夏季温度。此外,我们使用气候变量和植物生物群落来定义代表南非、莱索托和斯威士兰环境区域的五分格子集。对于每个环境区域,我们量化了抽样强度,并使用拟合渐近洛莫利诺模型的物种累积曲线评估了抽样完整性。抽样工作在靠近抽样中心、主要道路、城市地区和保护区的地方最为密集。耕地面积和气候变量的重要性较低。此外,当前数据并未均匀地代表各个环境区域,而且不同区域在代表现存物种所需的抽样量方面存在差异。SABAP2志愿者在观鸟地点的偏好导致了数据集中的空间偏差,在分析这些数据时应予以考虑。南非的大部分地区仍然代表性不足,这可能会限制能够解决的生态问题类型。然而,在考虑志愿者偏好的同时,将志愿者引导至抽样不足的地区,可能会改善抽样偏差。