Nyandwi E, Veldkamp A, Amer S, Karema C, Umulisa I
Faculty of Geo-Information Science and Earth Observation (ITC), University of Twente, P. O. Box 217, 7500 AE, Enschede, the Netherlands.
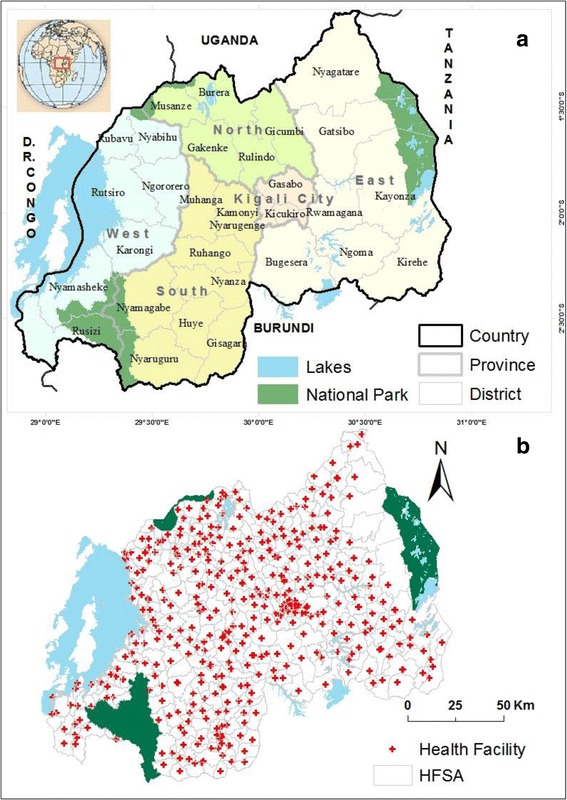
Geographic Information Systems and Remote Sensing Centre of University of Rwanda, P.O Box 212, Huye, Rwanda.
BMC Public Health. 2017 Oct 25;17(1):845. doi: 10.1186/s12889-017-4816-4.
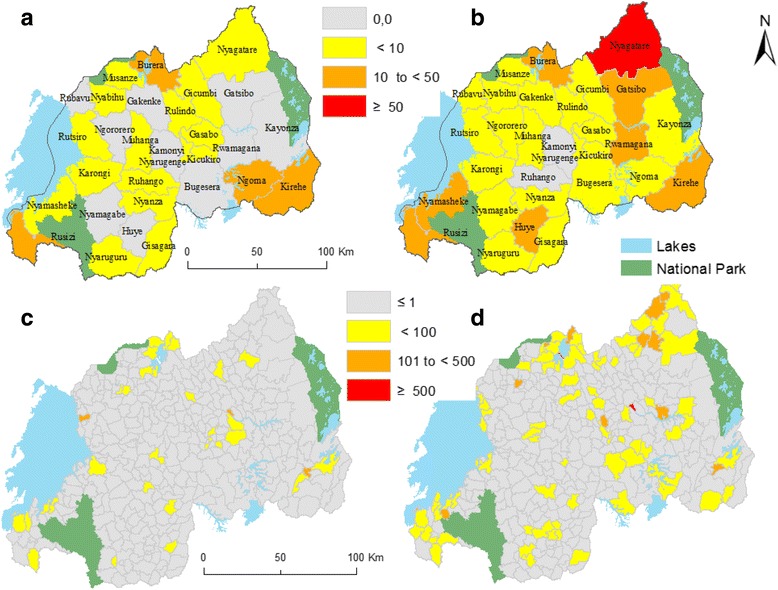
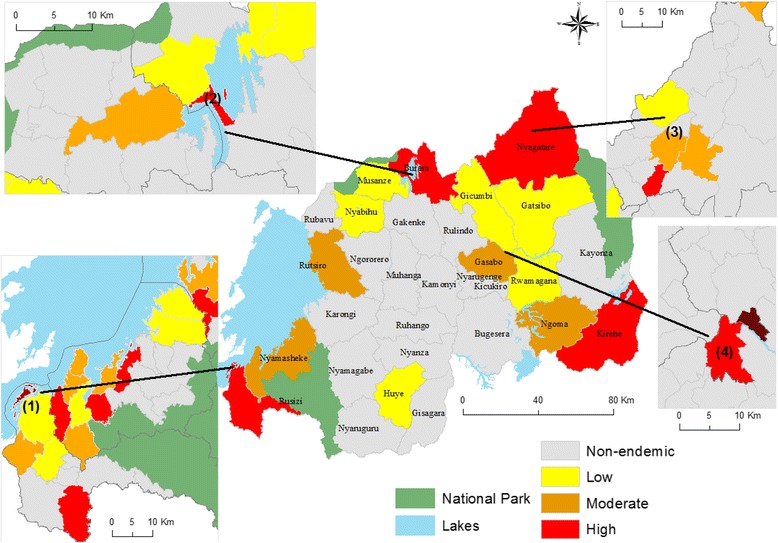
Schistosomiasis mansoni constitutes a significant public health problem in Rwanda. The nationwide prevalence mapping conducted in 2007-2008 revealed that prevalence per district ranges from 0 to 69.5% among school children. In response, mass drug administration campaigns were initiated. However, a few years later some additional small-scale studies revealed the existence of areas of high transmission in districts formerly classified as low endemic suggesting the need for a more accurate methodology for identification of hotspots. This study investigated if confirmed cases of schistosomiasis recorded at health facility level can be used to, next to existing prevalence data, detect geographically more accurate hotspots of the disease and its associated risk factors.
A GIS-based spatial and statistical analysis was carried out. Confirmed cases, recorded at primary health facilities level, were combined with demographic data to calculate incidence rates for each of 367 health facility service area. Empirical Bayesian smoothing was used to deal with rate instability. Incidence rates were compared with prevalence data to identify their level of agreement. Spatial autocorrelation of the incidence rates was analyzed using Moran's Index, to check if spatial clustering occurs. Finally, the spatial relationship between schistosomiasis distribution and potential risk factors was assessed using multiple regression.
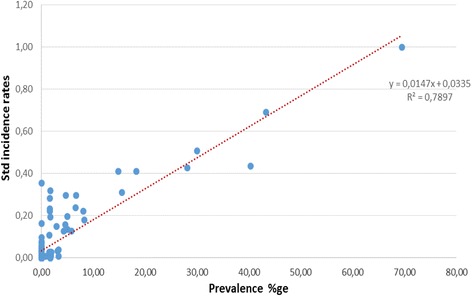
Incidence rates for 2007-2008 were highly correlated with prevalence values (R = 0.79), indicating that in the case of Rwanda incidence data can be used as a proxy for prevalence data. We observed a focal distribution of schistosomiasis with a significant spatial autocorrelation (Moran's I > 0: 0,05-0.20 and p ≤ 0,05), indicating the occurrence of hotspots. Regarding risk factors, it was identified that the spatial pattern of schistosomiasis is significantly associated with wetland conditions and rice cultivation.
In Rwanda the high density of health facilities and the standardized microscopic laboratory diagnostic allow the derived data to be used to complement prevalence studies to identify hotspots of schistosomiasis and its associated risk factors. This type of information, in turn, can support disease control interventions and monitoring.
曼氏血吸虫病是卢旺达一个重大的公共卫生问题。2007 - 2008年开展的全国患病率测绘显示,各地区学童的患病率在0%至69.5%之间。作为应对措施,启动了大规模药物治疗运动。然而,几年后一些额外的小规模研究显示,在以前被归类为低流行区的地区存在高传播区域,这表明需要一种更准确的方法来识别热点地区。本研究调查了在卫生机构层面记录的确诊血吸虫病病例,除现有患病率数据外,是否可用于在地理上更准确地检测该病的热点地区及其相关风险因素。
进行了基于地理信息系统(GIS)的空间和统计分析。将在初级卫生机构层面记录的确诊病例与人口数据相结合,以计算367个卫生机构服务区中每个区的发病率。采用经验贝叶斯平滑法处理发病率的不稳定性。将发病率与患病率数据进行比较,以确定它们的一致程度。使用莫兰指数(Moran's Index)分析发病率的空间自相关性,以检查是否存在空间聚集现象。最后,使用多元回归评估血吸虫病分布与潜在风险因素之间的空间关系。
2007 - 2008年的发病率与患病率值高度相关(R = 0.79),这表明在卢旺达的情况下,发病率数据可作为患病率数据的替代指标。我们观察到血吸虫病呈聚集分布,具有显著的空间自相关性(莫兰指数I > 0: 0.05 - 0.20且p≤0.05),表明存在热点地区。关于风险因素,已确定血吸虫病的空间格局与湿地条件和水稻种植显著相关。
在卢旺达,卫生机构的高密度分布以及标准化的显微镜实验室诊断使得所获得的数据能够用于补充患病率研究,以识别血吸虫病的热点地区及其相关风险因素。反过来,这类信息可以支持疾病控制干预措施和监测工作。