• 文献检索
  • 文档翻译
  • 深度研究
  • 学术资讯
  • Suppr Zotero 插件Zotero 插件
  • 邀请有礼
  • 套餐&价格
  • 历史记录
应用&插件
Suppr Zotero 插件Zotero 插件浏览器插件Mac 客户端Windows 客户端微信小程序
定价
高级版会员购买积分包购买API积分包
服务
文献检索文档翻译深度研究API 文档MCP 服务
关于我们
关于 Suppr公司介绍联系我们用户协议隐私条款
关注我们

Suppr 超能文献

核心技术专利:CN118964589B侵权必究
粤ICP备2023148730 号-1Suppr @ 2026

文献检索

告别复杂PubMed语法,用中文像聊天一样搜索,搜遍4000万医学文献。AI智能推荐,让科研检索更轻松。

立即免费搜索

文件翻译

保留排版,准确专业,支持PDF/Word/PPT等文件格式,支持 12+语言互译。

免费翻译文档

深度研究

AI帮你快速写综述,25分钟生成高质量综述,智能提取关键信息,辅助科研写作。

立即免费体验

基于多分辨率普查和卫星产量数据集的主要作物全球产量的潜力不确定性和近期变化。

Uncertainties of potentials and recent changes in global yields of major crops resulting from census- and satellite-based yield datasets at multiple resolutions.

机构信息

Institute for Agro-Environmental Sciences, National Agriculture and Food Research Organization (NARO), Tsukuba, Ibaraki, Japan.

Graduate School of Life and Environmental Sciences, University of Tsukuba, Tsukuba, Ibaraki, Japan.

出版信息

PLoS One. 2018 Sep 20;13(9):e0203809. doi: 10.1371/journal.pone.0203809. eCollection 2018.

DOI:10.1371/journal.pone.0203809
PMID:30235237
原文链接:https://pmc.ncbi.nlm.nih.gov/articles/PMC6147479/
Abstract

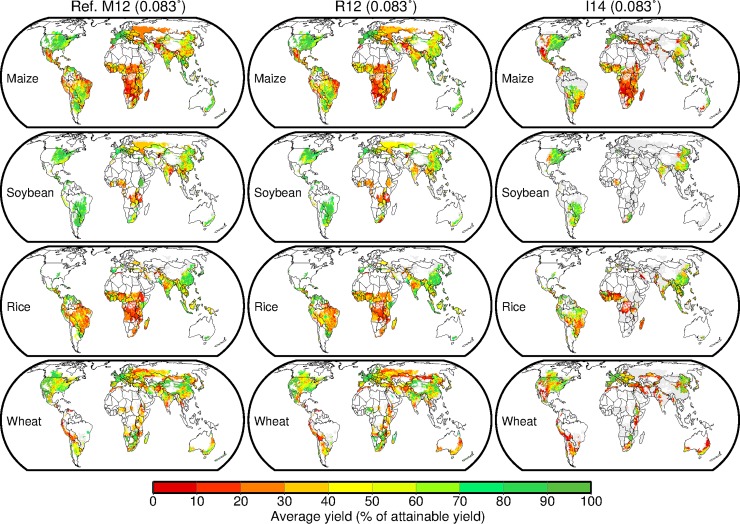
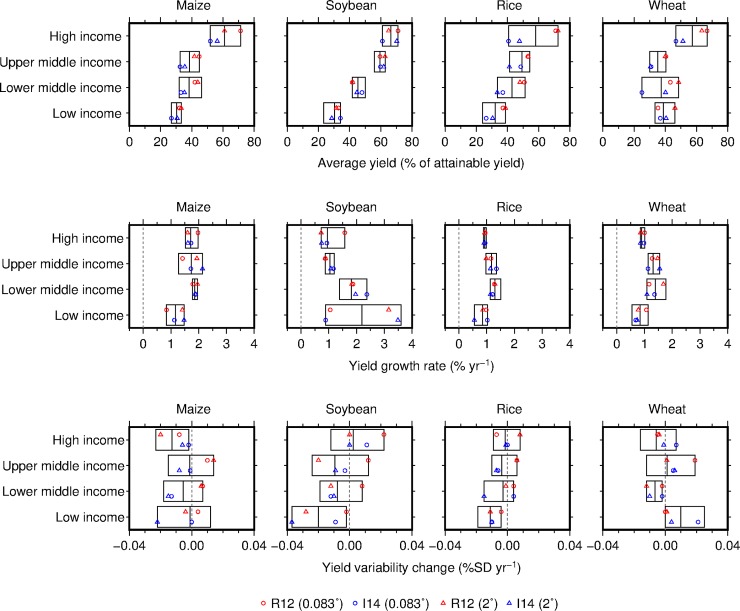
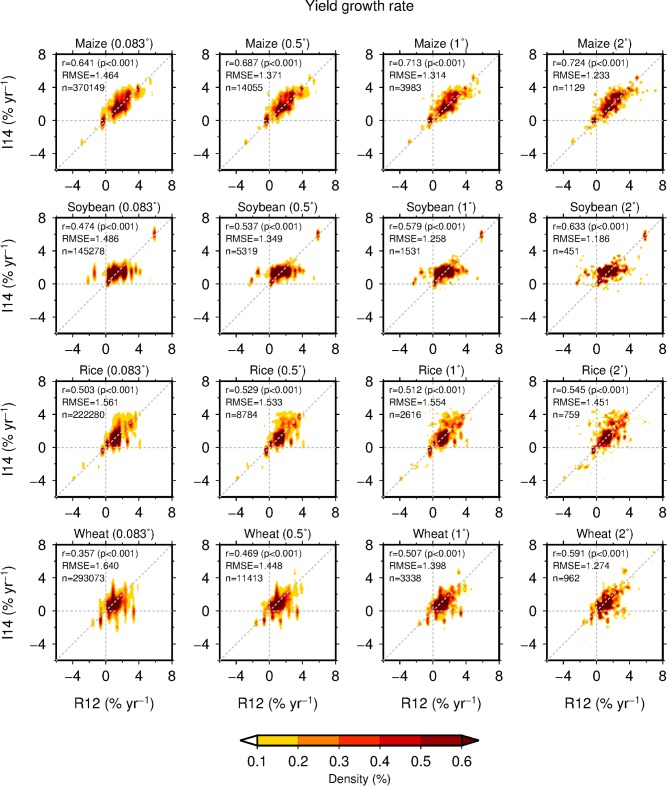
Global agriculture is under pressure to meet increasing demand for food and agricultural products. There are several global assessments of crop yields, but we know little about the uncertainties of their key findings, as the assessments are driven by the single best yield dataset available when each assessment was conducted. Recently, two different spatially explicit, global, historical yield datasets, one based on agricultural census and the other largely based on satellite remote sensing, became available. Using these datasets, we compare the similarities and differences in global yield gaps, trend patterns, growth rates and changes in year-to-year variability. We analyzed maize, rice, wheat and soybean for the period of 1981 to 2008 at four resolutions (0.083°, 0.5°, 1.0° and 2.0°). Although estimates varied by dataset and resolution, the global mean annual growth rates of 1.7-1.8%, 1.5-1.7%, 1.1-1.3% and 1.4-1.6% for maize, rice, wheat and soybean, respectively, are not on track to double crop production by 2050. Potential production increases that can be attributed to closing yield gaps estimated from the satellite-based dataset are almost twice those estimated from the census-based dataset. Detected yield variability changes in rice and wheat are sensitive to the choice of dataset and resolution, but they are relatively robust for maize and soybean. Estimates of yield gaps and variability changes are more uncertain than those of yield trend patterns and growth rates. These tendencies are consistent across crops. Efforts to reduce uncertainties are required to gain a better understanding of historical change and crop production potential to better inform agricultural policies and investments.

摘要

全球农业正面临着满足日益增长的粮食和农产品需求的压力。有几项全球作物产量评估,但我们对其关键发现的不确定性知之甚少,因为每项评估都是根据评估时可用的最佳单产数据集进行的。最近,两个不同的、具有空间明确性的、全球性的、历史性的产量数据集,一个基于农业普查,另一个主要基于卫星遥感,已经可用。我们使用这些数据集比较了全球产量差距、趋势模式、增长率和年际变化的可变性的异同。我们分析了 1981 年至 2008 年期间的玉米、水稻、小麦和大豆,分辨率为 0.083°、0.5°、1.0°和 2.0°。尽管估计值因数据集和分辨率而异,但玉米、水稻、小麦和大豆的全球年平均增长率分别为 1.7-1.8%、1.5-1.7%、1.1-1.3%和 1.4-1.6%,均无法实现到 2050 年作物产量翻番的目标。可以归因于从基于卫星的数据集估计的缩小产量差距的潜在产量增长几乎是从基于普查的数据集估计的两倍。从水稻和小麦中检测到的产量可变性变化对数据集和分辨率的选择敏感,但对于玉米和大豆来说,它们相对稳健。产量差距和可变性变化的估计比产量趋势模式和增长率的估计更不确定。这些趋势在各种作物中是一致的。需要努力减少不确定性,以更好地了解历史变化和作物生产潜力,从而更好地为农业政策和投资提供信息。

https://cdn.ncbi.nlm.nih.gov/pmc/blobs/5e87/6147479/f5dd65fbf7ff/pone.0203809.g005.jpg
https://cdn.ncbi.nlm.nih.gov/pmc/blobs/5e87/6147479/09141ca8d8a9/pone.0203809.g001.jpg
https://cdn.ncbi.nlm.nih.gov/pmc/blobs/5e87/6147479/46576e23788f/pone.0203809.g002.jpg
https://cdn.ncbi.nlm.nih.gov/pmc/blobs/5e87/6147479/7e8d6480ce0f/pone.0203809.g003.jpg
https://cdn.ncbi.nlm.nih.gov/pmc/blobs/5e87/6147479/f4a26aff8309/pone.0203809.g004.jpg
https://cdn.ncbi.nlm.nih.gov/pmc/blobs/5e87/6147479/f5dd65fbf7ff/pone.0203809.g005.jpg

相似文献

1
Uncertainties of potentials and recent changes in global yields of major crops resulting from census- and satellite-based yield datasets at multiple resolutions.基于多分辨率普查和卫星产量数据集的主要作物全球产量的潜力不确定性和近期变化。
PLoS One. 2018 Sep 20;13(9):e0203809. doi: 10.1371/journal.pone.0203809. eCollection 2018.
2
Recent patterns of crop yield growth and stagnation.近年来作物产量的增长和停滞模式。
Nat Commun. 2012;3:1293. doi: 10.1038/ncomms2296.
3
Responses of crop yield growth to global temperature and socioeconomic changes.作物产量增长对全球温度和社会经济变化的响应。
Sci Rep. 2017 Aug 10;7(1):7800. doi: 10.1038/s41598-017-08214-4.
4
The global dataset of historical yields for major crops 1981-2016.全球主要作物 1981-2016 年历史产量数据集。
Sci Data. 2020 Mar 20;7(1):97. doi: 10.1038/s41597-020-0433-7.
5
Global evaluation of a semiempirical model for yield anomalies and application to within-season yield forecasting.全球评估产量异常的半经验模型及其在季节内产量预测中的应用。
Glob Chang Biol. 2017 Nov;23(11):4750-4764. doi: 10.1111/gcb.13738. Epub 2017 Jun 1.
6
How does climate change affect potential yields of four staple grain crops worldwide by 2030?气候变化将如何影响 2030 年全球四种主要粮食作物的潜在产量?
PLoS One. 2024 May 31;19(5):e0303857. doi: 10.1371/journal.pone.0303857. eCollection 2024.
7
Yield Trends Are Insufficient to Double Global Crop Production by 2050.单产趋势不足以在2050年前使全球作物产量翻番。
PLoS One. 2013 Jun 19;8(6):e66428. doi: 10.1371/journal.pone.0066428. Print 2013.
8
High-resolution global maps of yield potential with local relevance for targeted crop production improvement.具有地方相关性的高分辨率全球产量潜力图,用于有针对性地提高作物产量。
Nat Food. 2024 Aug;5(8):667-672. doi: 10.1038/s43016-024-01029-3. Epub 2024 Jul 29.
9
Climate trends and global crop production since 1980.自 1980 年以来的气候趋势和全球作物产量。
Science. 2011 Jul 29;333(6042):616-20. doi: 10.1126/science.1204531. Epub 2011 May 5.
10
Climate-Driven Crop Yield and Yield Variability and Climate Change Impacts on the U.S. Great Plains Agricultural Production.气候驱动的作物产量和产量变异性及气候变化对美国大平原农业生产的影响。
Sci Rep. 2018 Feb 22;8(1):3450. doi: 10.1038/s41598-018-21848-2.

引用本文的文献

1
Integrating multi-omics and machine learning for disease resistance prediction in legumes.整合多组学和机器学习用于豆类抗病性预测
Theor Appl Genet. 2025 Jun 27;138(7):163. doi: 10.1007/s00122-025-04948-2.
2
Intercropping Maize-Faba Bean Reduced Yield and Economic Losses Caused by (Fuller) in Semiarid Area.玉米-蚕豆间作降低了半干旱地区由(富勒)造成的产量和经济损失。
Scientifica (Cairo). 2024 Oct 29;2024:4929479. doi: 10.1155/2024/4929479. eCollection 2024.
3
Unraveling plant-microbe interactions: can integrated omics approaches offer concrete answers?

本文引用的文献

1
Global evaluation of a semiempirical model for yield anomalies and application to within-season yield forecasting.全球评估产量异常的半经验模型及其在季节内产量预测中的应用。
Glob Chang Biol. 2017 Nov;23(11):4750-4764. doi: 10.1111/gcb.13738. Epub 2017 Jun 1.
2
The fingerprint of climate trends on European crop yields.欧洲作物产量上气候趋势的特征
Proc Natl Acad Sci U S A. 2015 Mar 3;112(9):2670-5. doi: 10.1073/pnas.1409606112. Epub 2015 Feb 17.
3
Mapping global cropland and field size.绘制全球耕地和地块图。
解析植物-微生物相互作用:综合组学方法能否提供具体答案?
J Exp Bot. 2024 Feb 28;75(5):1289-1313. doi: 10.1093/jxb/erad448.
4
Transcriptomic and co-expression network analyses on diverse wheat landraces identifies candidate master regulators of the response to early drought.对多种小麦地方品种进行转录组和共表达网络分析,鉴定出对早期干旱响应的候选主调控因子。
Front Plant Sci. 2023 Jun 23;14:1212559. doi: 10.3389/fpls.2023.1212559. eCollection 2023.
5
Data-driven projections suggest large opportunities to improve Europe's soybean self-sufficiency under climate change.数据驱动的预测表明,在气候变化下,欧洲有很大的机会提高大豆自给自足水平。
Nat Food. 2022 Apr;3(4):255-265. doi: 10.1038/s43016-022-00481-3. Epub 2022 Apr 7.
6
Genetic trends in CIMMYT's tropical maize breeding pipelines.热带玉米 CIMMYT 育种种质资源库的遗传趋势
Sci Rep. 2022 Nov 22;12(1):20110. doi: 10.1038/s41598-022-24536-4.
7
Bio-fertilizer Affects Structural Dynamics, Function, and Network Patterns of the Sugarcane Rhizospheric Microbiota.生物肥料影响甘蔗根际微生物区系的结构动态、功能和网络模式。
Microb Ecol. 2022 Nov;84(4):1195-1211. doi: 10.1007/s00248-021-01932-3. Epub 2021 Nov 24.
8
The look ahead trace back optimizer for genomic selection under transparent and opaque simulators.基于透明和不透明模拟器的基因组选择展望回溯优化器。
Sci Rep. 2021 Feb 18;11(1):4124. doi: 10.1038/s41598-021-83567-5.
9
Beat the stress: breeding for climate resilience in maize for the tropical rainfed environments.应对压力:在热带雨养环境中培育具有气候韧性的玉米。
Theor Appl Genet. 2021 Jun;134(6):1729-1752. doi: 10.1007/s00122-021-03773-7. Epub 2021 Feb 16.
10
The global dataset of historical yields for major crops 1981-2016.全球主要作物 1981-2016 年历史产量数据集。
Sci Data. 2020 Mar 20;7(1):97. doi: 10.1038/s41597-020-0433-7.
Glob Chang Biol. 2015 May;21(5):1980-92. doi: 10.1111/gcb.12838. Epub 2015 Jan 16.
4
Climate variation explains a third of global crop yield variability.气候变化解释了全球作物产量变异性的三分之一。
Nat Commun. 2015 Jan 22;6:5989. doi: 10.1038/ncomms6989.
5
Crop yield response to climate change varies with cropping intensity.作物产量对气候变化的响应随种植强度而变化。
Glob Chang Biol. 2015 Apr;21(4):1679-88. doi: 10.1111/gcb.12808. Epub 2015 Jan 8.
6
Impacts of El Niño Southern Oscillation on the global yields of major crops.厄尔尼诺南方涛动对全球主要作物产量的影响。
Nat Commun. 2014 May 15;5:3712. doi: 10.1038/ncomms4712.
7
Distinguishing between yield advances and yield plateaus in historical crop production trends.区分历史作物生产趋势中的产量提高和产量稳定期。
Nat Commun. 2013;4:2918. doi: 10.1038/ncomms3918.
8
Yield Trends Are Insufficient to Double Global Crop Production by 2050.单产趋势不足以在2050年前使全球作物产量翻番。
PLoS One. 2013 Jun 19;8(6):e66428. doi: 10.1371/journal.pone.0066428. Print 2013.
9
Recent patterns of crop yield growth and stagnation.近年来作物产量的增长和停滞模式。
Nat Commun. 2012;3:1293. doi: 10.1038/ncomms2296.
10
Closing yield gaps through nutrient and water management.通过养分和水分管理来缩小产量差距。
Nature. 2012 Oct 11;490(7419):254-7. doi: 10.1038/nature11420. Epub 2012 Aug 29.