Faculty of Geo-Information Science and Earth Observation (ITC), University of Twente, Enschede, Netherlands.
ECHO Research Group International, Aflao, Ghana.
PLoS One. 2018 Nov 29;13(11):e0208006. doi: 10.1371/journal.pone.0208006. eCollection 2018.
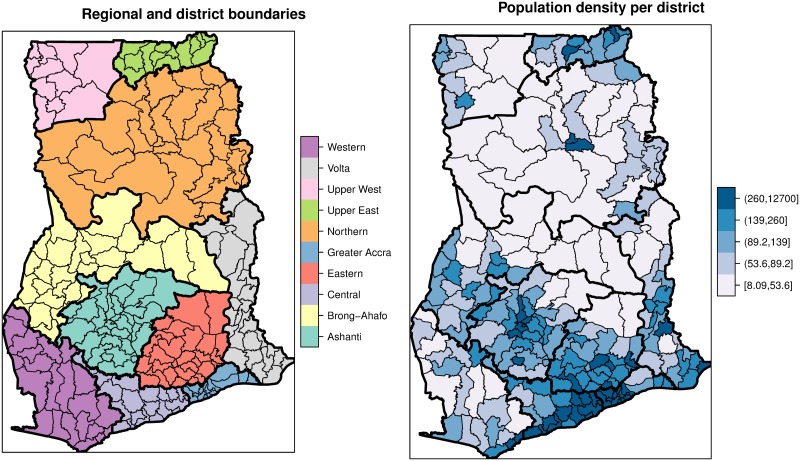
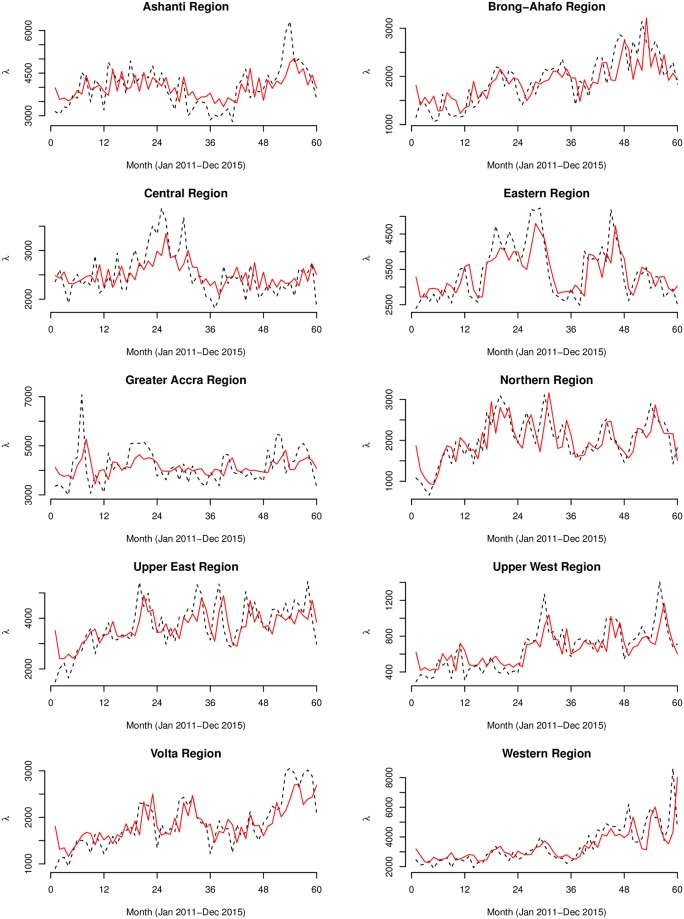
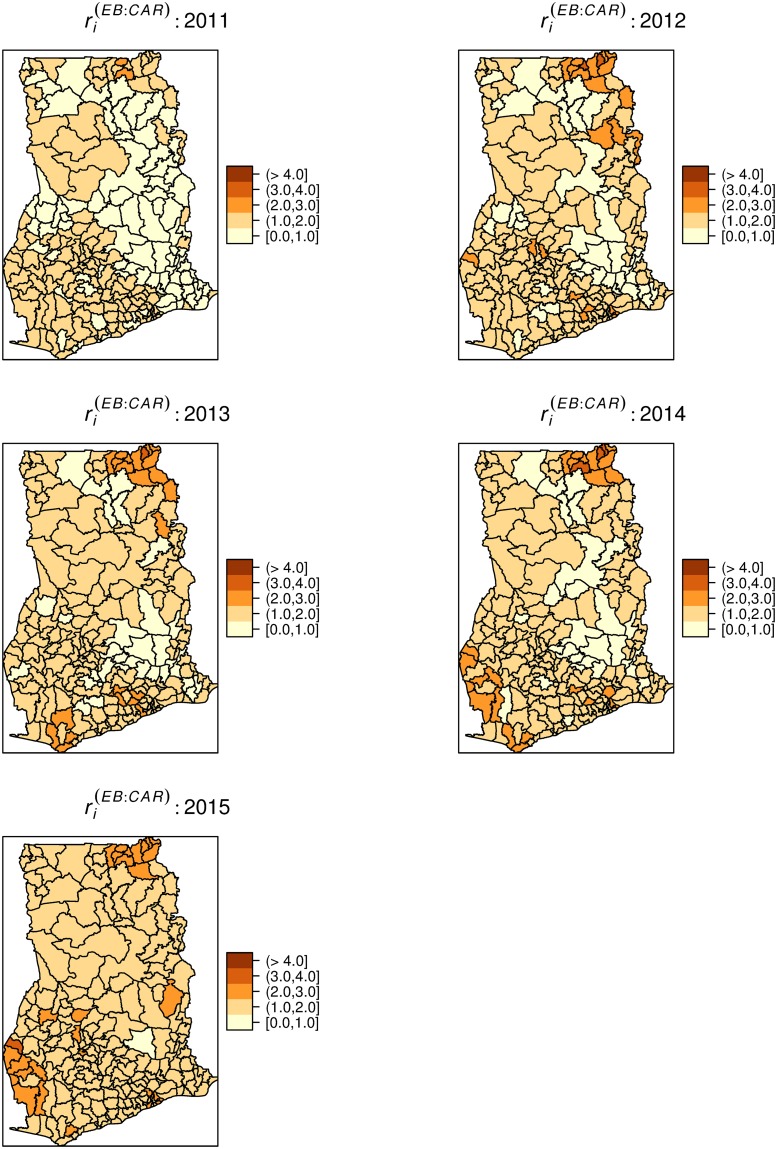
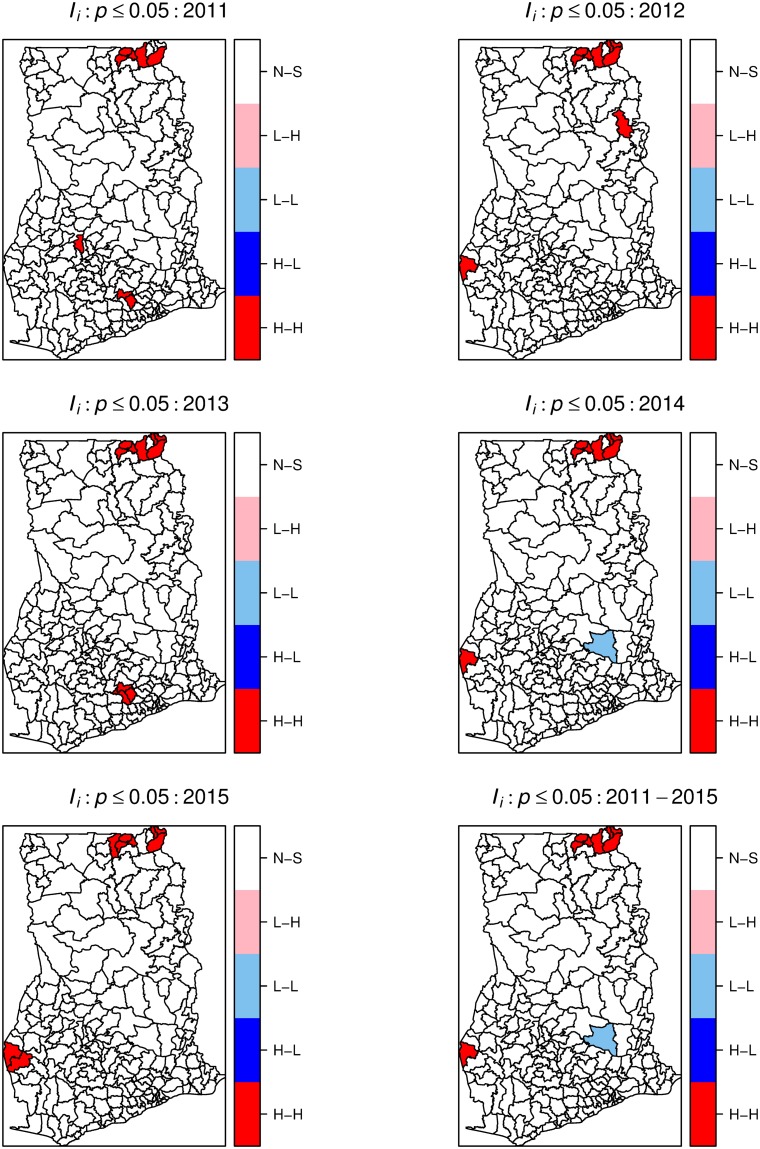
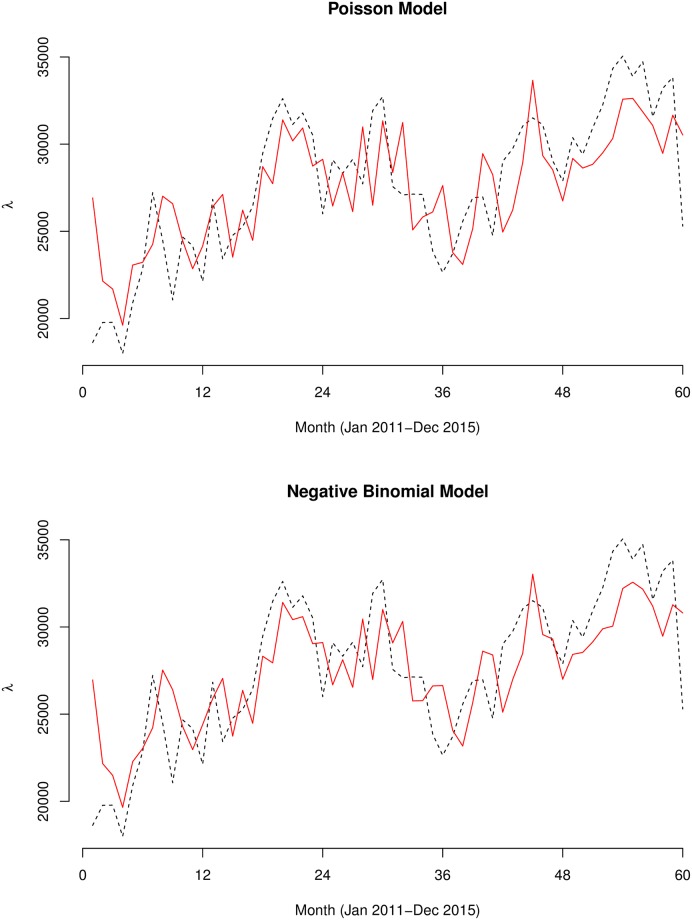
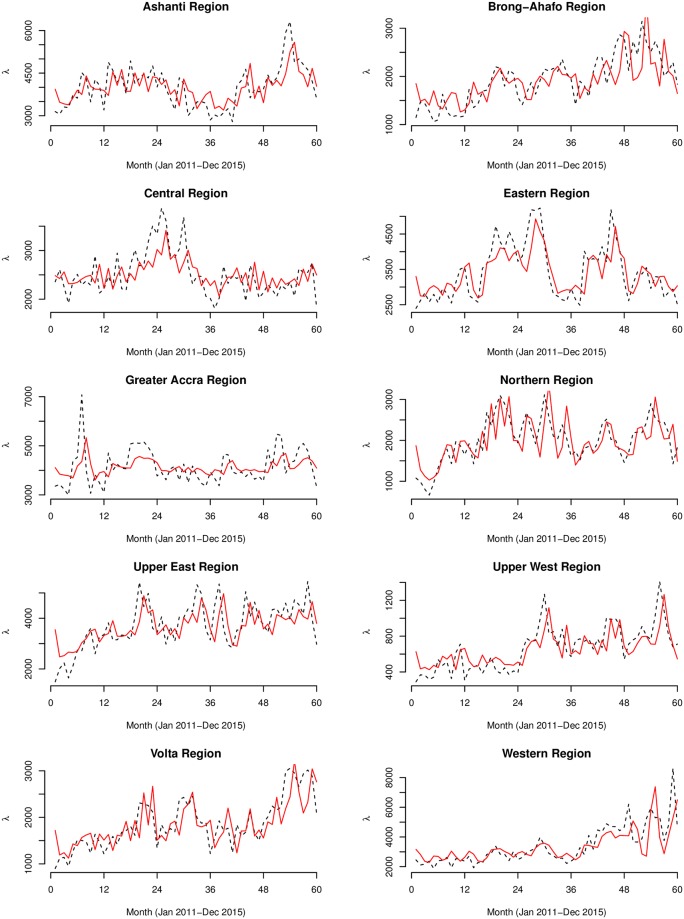
Typhoid fever is estimated to cause between 9.9-24.2 million cases and 75,000-208,000 deaths per year globally. Low-income and middle-income countries report the majority of cases, especially those in sub-Saharan Africa. The epidemiology of typhoid fever is poorly understood, particularly in Ghana where there has been no study of the within-country variation. Our objective was to explore and analyze the spatial and temporal patterns of typhoid fever morbidities in Ghana. We used the global and local Moran's indices to uncover the existence of global and local spatial patterns, respectively. Generalized linear autoregressive moving average (glarma) models were developed to explore the overall and regional level temporal patterns of morbidities. The overall index of spatial association was 0.19 (p < 0.001). The global Moran's monthly indices of clustering ranged from ≈ 0 - 0.28, with few non-significant (p > 0.05) estimates. The yearly estimates were all significant (p < 0.001) and ranged from 0.1-0.19, suggesting spatial clustering of typhoid. The local Moran's maps indicated isolated high contributions of clustering within the Upper West and Western regions. The overall and regional level glarma models indicated significant first and second-order serial correlation as well as quarterly trends. These findings can provide relevant epidemiological insight into the spatial and temporal patterns of typhoid epidemiology and useful to complement the development of control strategies by public health managers.
全球每年估计有 990 万至 2420 万例伤寒病例和 7.5 万至 20.8 万例伤寒死亡病例。低收入和中等收入国家报告了大多数病例,特别是撒哈拉以南非洲的国家。伤寒的流行病学情况了解甚少,在加纳尤其如此,加纳尚未对国内的变异情况进行研究。我们的目的是探讨和分析加纳伤寒发病率的空间和时间模式。我们使用全球和局部 Moran 指数分别揭示了全球和局部空间模式的存在。开发了广义线性自回归移动平均(glarma)模型来探索发病率的整体和区域水平的时间模式。总体空间关联指数为 0.19(p < 0.001)。聚类的全球 Moran 月度指数范围约为 0 - 0.28,少数估计值无统计学意义(p > 0.05)。每年的估计值均具有统计学意义(p < 0.001),范围为 0.1-0.19,表明伤寒存在空间聚类。局部 Moran 地图表明,上西部和西部地区存在孤立的聚类高贡献。总体和区域水平的 glarma 模型表明存在显著的一阶和二阶序列相关性以及季度趋势。这些发现可以为伤寒流行病学的空间和时间模式提供相关的流行病学见解,并有助于公共卫生管理者补充控制策略的制定。