Acute Vascular Imaging Centre, Radcliffe Department of Medicine, University of Oxford, Oxford, UK.
Division of Cardiovascular Medicine, BHF Centre of Research Excellence, University of Oxford, Oxford, UK.
J Cardiovasc Magn Reson. 2018 Dec 20;20(1):82. doi: 10.1186/s12968-018-0506-3.
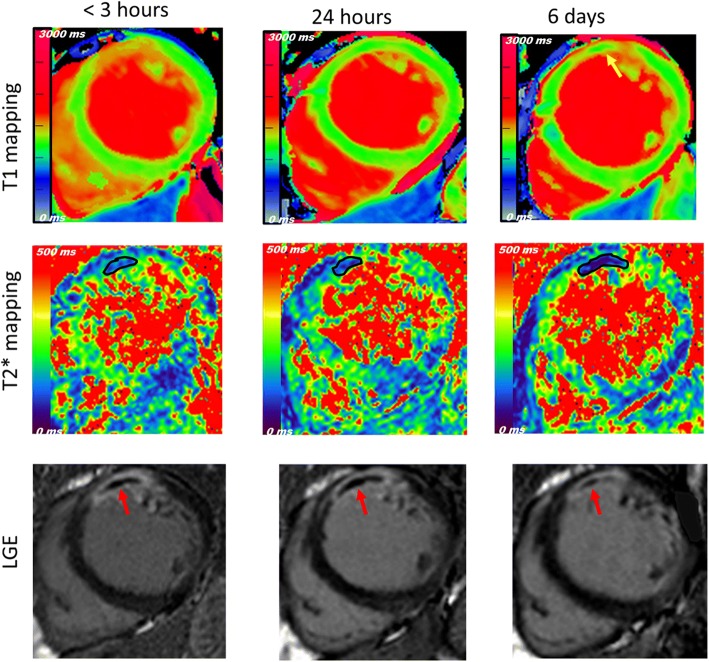
It has recently been suggested that myocardial oedema follows a bimodal pattern early post ST-segment elevation myocardial infarction (STEMI). Yet, water content, quantified using tissue desiccation, did not return to normal values unlike oedema quantified by cardiovascular magnetic resonance (CMR) imaging. We studied the temporal changes in the extent and intensity of injured myocardium using T1-mapping technique within the first week after STEMI.
A first group (n = 31) underwent 3 acute 3 T CMR scans (time-point (TP) < 3 h, 24 h and 6 days), including cine, native shortened modified look-locker inversion recovery T1 mapping, T2* mapping and late gadolinium enhancement (LGE). A second group (n = 17) had a single scan at 24 h with an additional T2-weighted sequence to assess the difference in the extent of area-at-risk (AAR) compared to T1-mapping.
The mean T1 relaxation time value within the AAR of the first group was reduced after 24 h (P < 0.001 for TP1 vs.TP2) and subsequently increased at 6 days (P = 0.041 for TP2 vs.TP3). However, the extent of AAR quantified using T1-mapping did not follow the same course, and no change was detected between TP1&TP2 (P = 1.0) but was between TP2 &TP3 (P = 0.019). In the second group, the extent of AAR was significantly larger on T1-mapping compared to T2-weighted (42 ± 15% vs. 39 ± 15%, P = 0.025). No change in LGE was detected while microvascular obstruction and intra-myocardial haemorrhage peaked at different time points within the first week of reperfusion.
The intensity of oedema post-STEMI followed a bimodal pattern; while the extent of AAR did not track the same course. This discrepancy has implications for use of CMR in this context and may explain the previously reported disagreement between oedema quantified by imaging and tissue desiccation.
最近有人提出,ST 段抬高型心肌梗死(STEMI)后早期心肌水肿呈双峰模式。然而,与心血管磁共振成像(CMR)成像量化的水肿不同,使用组织干燥量化的含水量并未恢复正常。我们使用 T1 映射技术在 STEMI 后第一周内研究了受伤心肌的范围和强度的时间变化。
第一组(n=31)接受了 3 次急性 3T CMR 扫描(时间点(TP)<3h、24h 和 6d),包括电影、原始缩短改良 Look-Locker 反转恢复 T1 映射、T2*映射和晚期钆增强(LGE)。第二组(n=17)在 24h 时进行了单次扫描,并增加了 T2 加权序列,以评估与 T1 映射相比,危险区(AAR)范围的差异。
第一组的 AAR 内平均 T1 弛豫时间值在 24h 后降低(TP1 与 TP2 相比,P<0.001),随后在 6d 时升高(TP2 与 TP3 相比,P=0.041)。然而,使用 T1 映射量化的 AAR 范围并未遵循相同的过程,TP1 和 TP2 之间没有变化(P=1.0),但 TP2 和 TP3 之间有变化(P=0.019)。在第二组中,与 T2 加权相比,T1 映射上的 AAR 范围明显更大(42±15% 比 39±15%,P=0.025)。在再灌注后的第一周内,微血管阻塞和心肌内出血达到峰值的时间点不同,但未检测到 LGE 变化。
STEMI 后水肿的强度呈双峰模式;而 AAR 的范围没有遵循相同的过程。这种差异对 CMR 在这种情况下的应用有影响,可能解释了以前报道的成像量化的水肿与组织干燥之间的不一致。