Department of Epidemiology and Biostatistics, University of California, San Francisco.
Public Policy Institute of California, San Francisco.
JAMA Netw Open. 2018 Sep 7;1(5):e182150. doi: 10.1001/jamanetworkopen.2018.2150.
Increased public concern regarding police use of force has coincided with a dearth of available data to uncover the magnitude and trends in injuries, particularly across race or ethnicity.
To examine trends in injury rates, severity, and disparities across black individuals, white individuals, Hispanic individuals, and Asian/Pacific Islander individuals.
DESIGN, SETTING, AND PARTICIPANTS: In this retrospective, cross-sectional study, data collected on every hospital visit in California from January 1, 2005, to September 30, 2015, were used to model trends in rates of legal intervention injuries (n = 92 386) per capita and per arrest for men aged 14 to 64 years, by race or ethnicity. The study also examined descriptive statistics on injury dispositions to assess changes in severity. Analyses were conducted between December 2017 and June 2018.
All visits with an external cause of injury code of E970 to E977 were classified as legal intervention injuries. This range of codes includes injuries inflicted by the police or other law-enforcing agents in the course of arresting or attempting to arrest lawbreakers, suppressing disturbances, maintaining order, and other legal action.
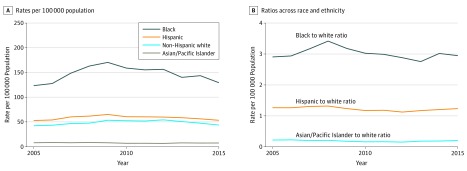
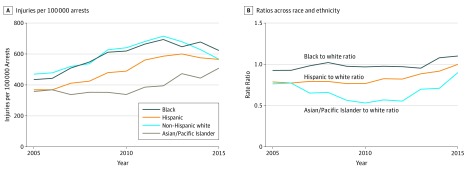
The study identified a total of 92 386 hospital visits that were the result of legal intervention among males aged 14 to 64 years. Black individuals were at the highest risk of legal intervention injury per capita in 2005 (for black vs white individuals, rate ratio, 2.90; 95% CI, 2.74-3.06), and remained so across the study period. Although rates among Asian/Pacific Islander individuals remained stable, rates in all other groups increased from 2005 to 2009 and then declined from 2009 to 2015, nearly returning to 2005 levels. During the period of increasing rates, the black to white disparity widened by 3% annually (rate ratio, 1.03; 95% CI, 1.01-1.05), then narrowed as rates declined. In contrast, rates of injury per arrest have increased over the past decade, although rates were broadly similar across race or ethnicity. The proportion of injuries involving firearms (ie, shootings by police) declined from 7.0% in 2005 and 2006 to 3.7% in 2014 and 2015.
States with central repositories for hospital visits offer data sources to illuminate the public health problem of legal intervention injuries, and warrant greater attention to ensure consistent coding for complete capture.
公众对警察使用武力的担忧日益增加,而可用数据却很少能揭示伤害的程度和趋势,尤其是在种族或族裔方面。
研究黑人、白人、西班牙裔和亚洲/太平洋岛民个体的伤害率、严重程度和差异趋势。
设计、设置和参与者:在这项回顾性、横断面研究中,使用了 2005 年 1 月 1 日至 2015 年 9 月 30 日期间加利福尼亚州每一次医院就诊的数据,对 14 至 64 岁男性每千人及每逮捕一人的法律干预伤害率(n=92386)进行建模,按种族或族裔进行划分。该研究还检查了伤害处置的描述性统计数据,以评估严重程度的变化。分析于 2017 年 12 月至 2018 年 6 月之间进行。
所有归因于外部伤害原因 E970 至 E977 编码的就诊均被归类为法律干预伤害。这一系列编码包括警察或其他执法人员在逮捕或试图逮捕违法者、镇压骚乱、维持秩序和其他法律行动过程中造成的伤害。
研究共确定了 92386 例 14 至 64 岁男性因法律干预而住院的病例。黑人个体在 2005 年每千人中法律干预伤害的风险最高(黑人与白人个体相比,比率比,2.90;95%CI,2.74-3.06),并且在整个研究期间一直如此。尽管亚洲/太平洋岛民个体的比例保持稳定,但所有其他群体的比例从 2005 年至 2009 年增加,然后从 2009 年至 2015 年下降,几乎回到 2005 年的水平。在发病率上升期间,黑人和白人之间的差距每年扩大 3%(比率比,1.03;95%CI,1.01-1.05),然后随着发病率下降而缩小。相比之下,过去十年中,每逮捕一人的伤害率有所上升,尽管种族或族裔之间的伤害率大致相似。涉及枪支(即警察枪击)的伤害比例从 2005 年和 2006 年的 7.0%下降到 2014 年和 2015 年的 3.7%。
拥有医院就诊中央存储库的州为阐明法律干预伤害这一公共卫生问题提供了数据来源,并需要更加关注,以确保进行一致编码以进行全面捕获。