School of Statistics, Shanxi University of Finance and Economics, 696 Wucheng Road, Taiyuan City, 030006, Shanxi Province, China.
School of Earth Science and Resources, Chang'an University, Middle-section of Nan'er Huan Road, Xi'an City, 710064, Shaanxi Province, China.
BMC Public Health. 2019 Jan 30;19(1):127. doi: 10.1186/s12889-019-6465-2.
Population ageing is an increasingly severe global issue. And this has been posing challenges for public health policies and medical resource allocation There are various features of population ageing in different regions worldwide.
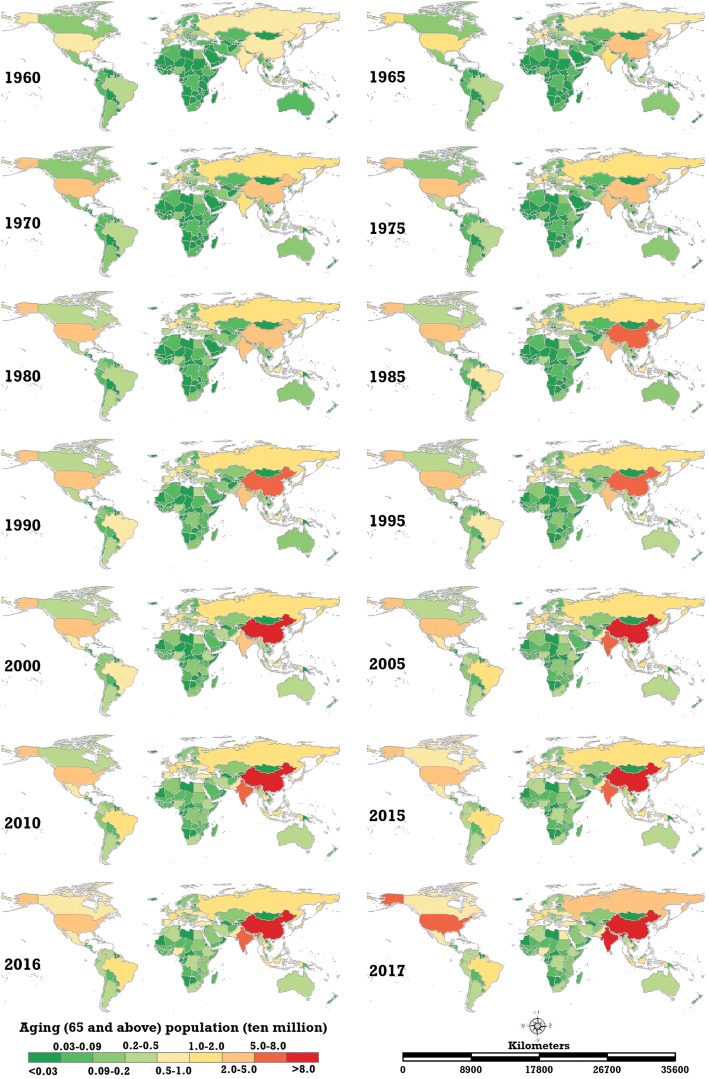
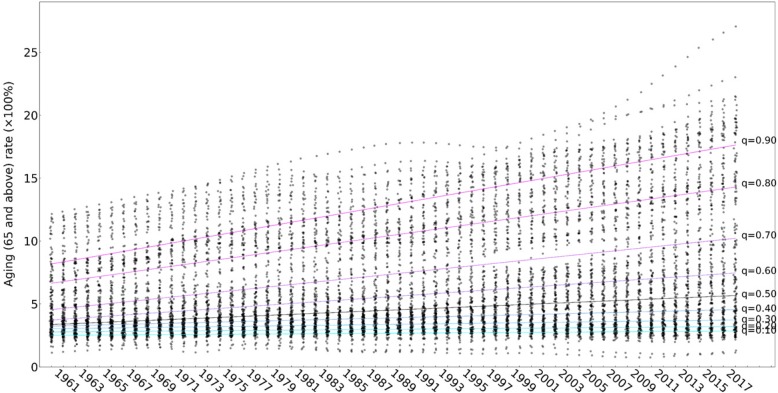
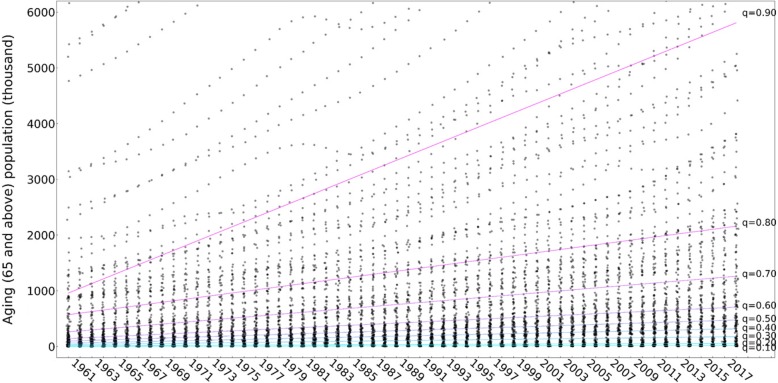
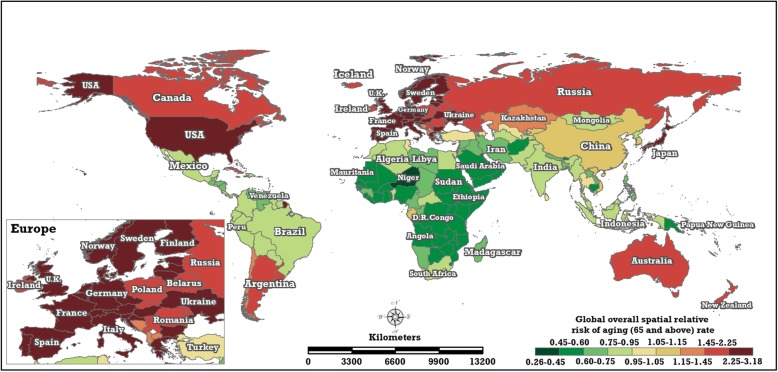
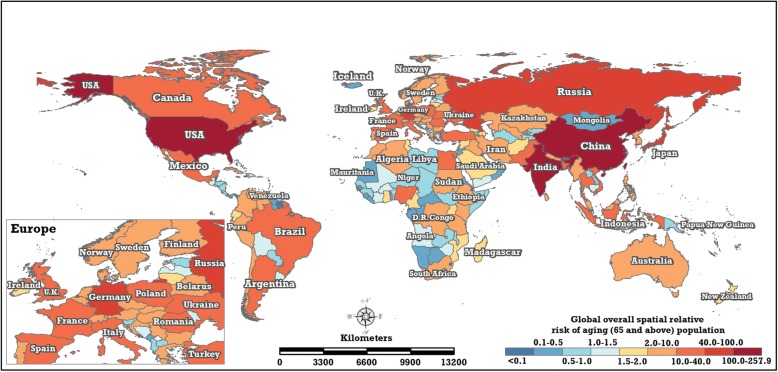
All data were obtained from the health data of World Bank Open Data. Quantile linear regression was used to subtly measure the common variation tendency and strength of the global ageing rate and ageing population. The Bayesian space-time hierarchy model (BSTHM) was employed to assess the detailed spatial temporal evolution of ageing rate and ageing population in global 195 countries and regions.
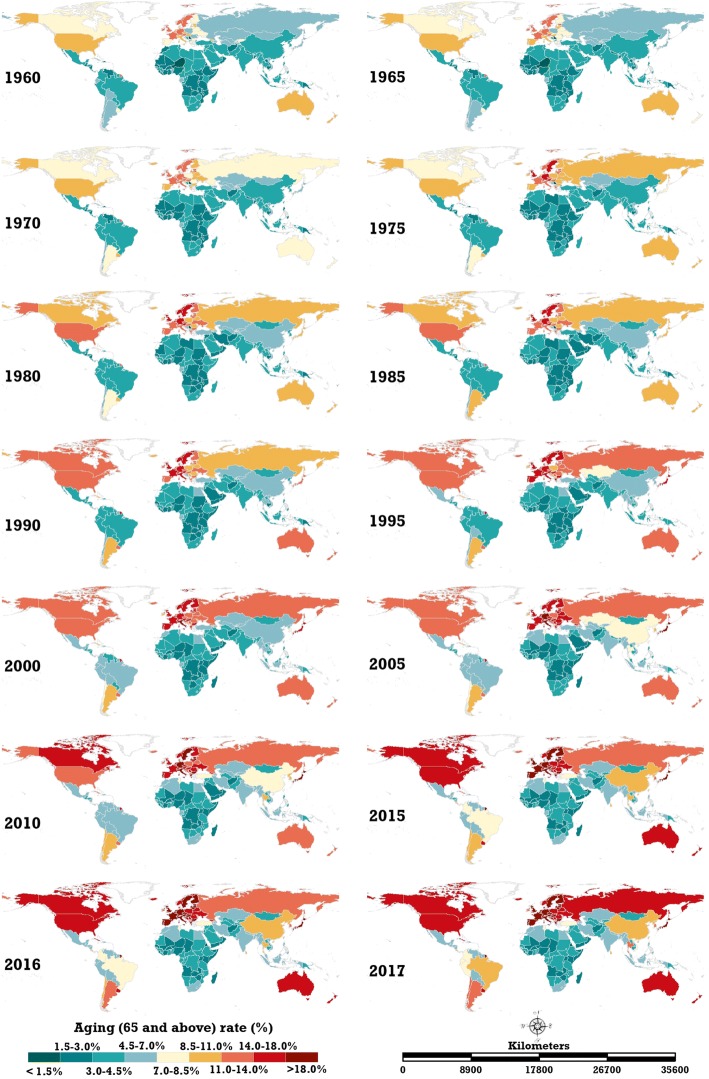
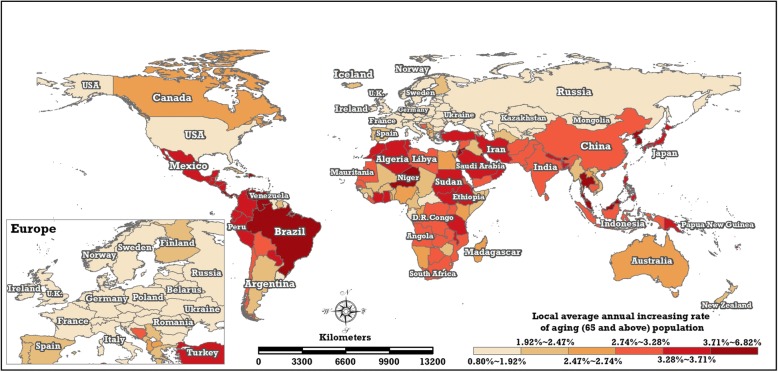
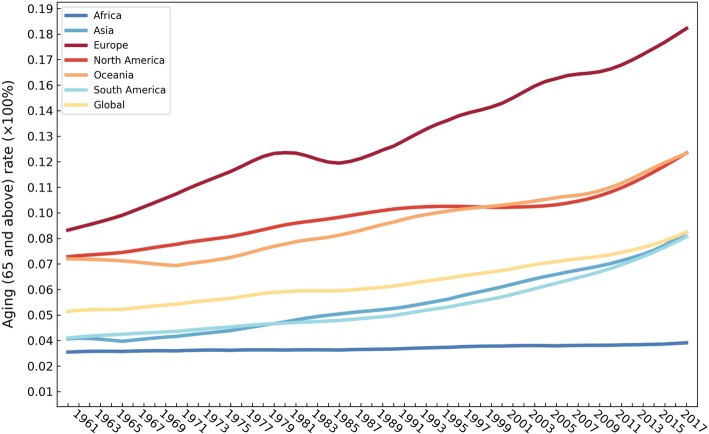
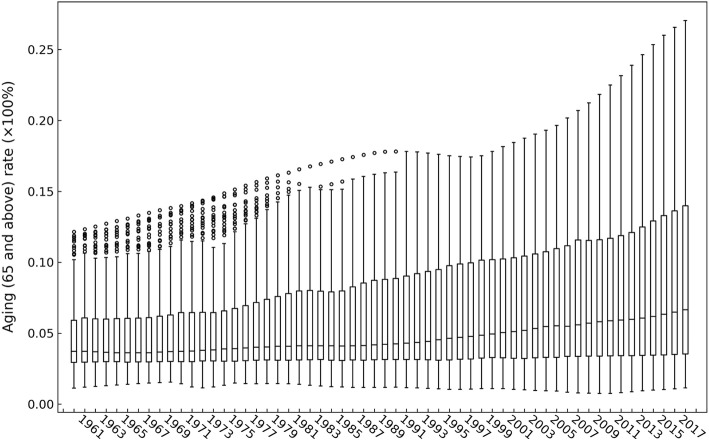
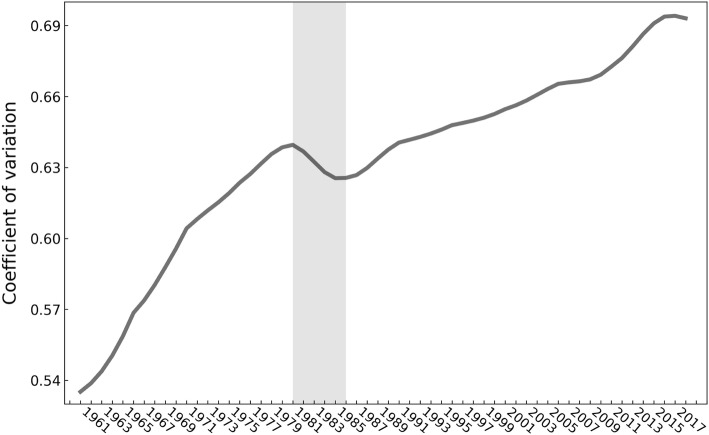
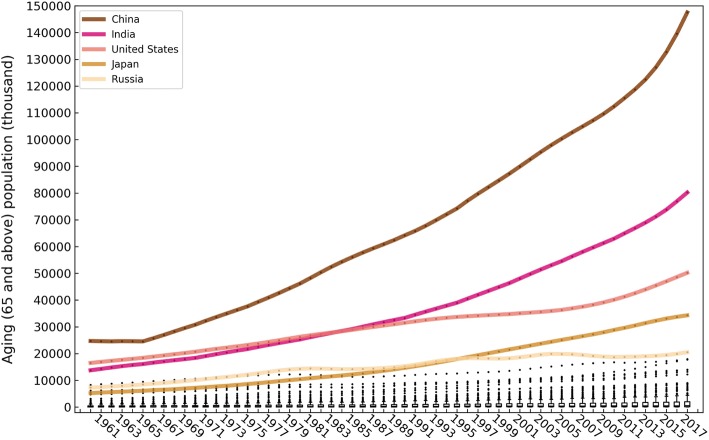
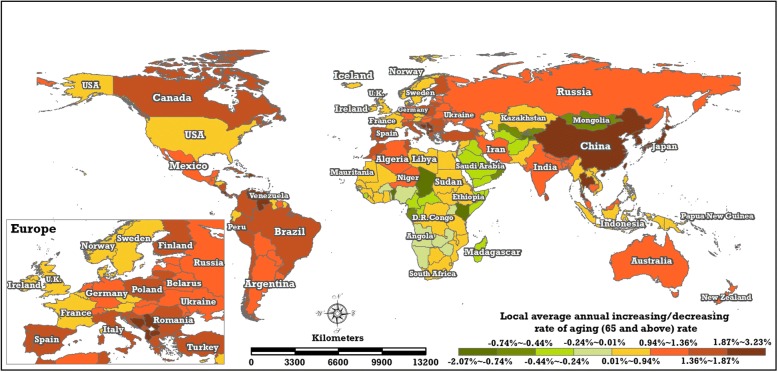
Annual growth of the ageing (65 and above) rate occurred on six continents: Europe (0.1532%), Oceania (0.0873%), Asia (0.0834%), South America (0.0723%), North America (0.0673%) and Africa (0.0069%). The coefficient of variation of the global ageing rate increased from 0.54 in 1960 to 0.69 in 2017. The global ageing rate and ageing population increased over this period, correlating positively with their quantiles. Most countries (37/39) in Europe belong to the top level with regard to the ageing rate, including the countries with the greatest degree of ageing-Sweden, Germany, Austria, Belgium and the UK-whose spatial relative risks of ageing are 3.180 (3.113-3.214), 3.071 (3.018-3.122), 2.951 (2.903-3.001), 2.932 (2.880-2.984) and 2.917 (2.869-2.967), respectively. Worldwide, 44 low ageing areas which were distributed mainly in Africa (26 areas) and Asia (15 areas) experienced a decreasing trend of ageing rates. The local trends of ageing population in the 195 areas increased.
The differentiation of global population ageing is becoming increasingly serious. Globally, all 195 areas showed an increasing local ageing trend in absolute terms, although there were 44 low-ageing areas that experienced a decreasing local trend of ageing rate. The statistical results may provide some baseline reference for developing public health policies in various countries or regions, especially in less-developed areas.
人口老龄化是一个日益严重的全球问题,这给公共卫生政策和医疗资源配置带来了挑战。世界不同地区的人口老龄化有不同的特点。
所有数据均来自世界银行开放数据的健康数据。使用分位数线性回归来微妙地衡量全球老龄化率和老年人口的共同变化趋势和强度。采用贝叶斯时空层次模型(BSTHM)评估全球 195 个国家和地区老龄化率和老年人口的详细时空演变。
六大洲的老龄化(65 岁及以上)率呈正增长:欧洲(0.1532%)、大洋洲(0.0873%)、亚洲(0.0834%)、南美洲(0.0723%)、北美洲(0.0673%)和非洲(0.0069%)。全球老龄化率的变异系数从 1960 年的 0.54 增加到 2017 年的 0.69。在此期间,全球老龄化率和老年人口均呈上升趋势,与它们的分位数呈正相关。欧洲的 37 个国家(39 个中的 37 个)在老龄化率方面属于最高水平,包括老龄化程度最大的国家——瑞典、德国、奥地利、比利时和英国,其老龄化的空间相对风险分别为 3.180(3.113-3.214)、3.071(3.018-3.122)、2.951(2.903-3.001)、2.932(2.880-2.984)和 2.917(2.869-2.967)。在全球范围内,主要分布在非洲(26 个地区)和亚洲(15 个地区)的 44 个低老龄化地区的老龄化率呈下降趋势。195 个地区的老年人口局部趋势增加。
全球人口老龄化的分化越来越严重。从全球范围来看,所有 195 个地区的老龄化趋势都呈绝对上升趋势,尽管有 44 个低龄化地区的老龄化率呈下降趋势。统计结果可能为各国或地区制定公共卫生政策提供一些基线参考,尤其是在欠发达地区。