• 文献检索
  • 文档翻译
  • 深度研究
  • 学术资讯
  • Suppr Zotero 插件Zotero 插件
  • 邀请有礼
  • 套餐&价格
  • 历史记录
应用&插件
Suppr Zotero 插件Zotero 插件浏览器插件Mac 客户端Windows 客户端微信小程序
定价
高级版会员购买积分包购买API积分包
服务
文献检索文档翻译深度研究API 文档MCP 服务
关于我们
关于 Suppr公司介绍联系我们用户协议隐私条款
关注我们

Suppr 超能文献

核心技术专利:CN118964589B侵权必究
粤ICP备2023148730 号-1Suppr @ 2026

文献检索

告别复杂PubMed语法,用中文像聊天一样搜索,搜遍4000万医学文献。AI智能推荐,让科研检索更轻松。

立即免费搜索

文件翻译

保留排版,准确专业,支持PDF/Word/PPT等文件格式,支持 12+语言互译。

免费翻译文档

深度研究

AI帮你快速写综述,25分钟生成高质量综述,智能提取关键信息,辅助科研写作。

立即免费体验

疾病爆发调查分析:基于网络的分析助力在疾病爆发过程中实现态势感知

Analytics for Investigation of Disease Outbreaks: Web-Based Analytics Facilitating Situational Awareness in Unfolding Disease Outbreaks.

作者信息

Velappan Nileena, Daughton Ashlynn Rae, Fairchild Geoffrey, Rosenberger William Earl, Generous Nicholas, Chitanvis Maneesha Elizabeth, Altherr Forest Michael, Castro Lauren A, Priedhorsky Reid, Abeyta Esteban Luis, Naranjo Leslie A, Hollander Attelia Dawn, Vuyisich Grace, Lillo Antonietta Maria, Cloyd Emily Kathryn, Vaidya Ashvini Rajendra, Deshpande Alina

机构信息

Los Alamos National Laboratory, Los Alamos, NM, United States.

Specifica Inc, New Mexico Consortium Biological Laboratory, Los Alamos, NM, United States.

出版信息

JMIR Public Health Surveill. 2019 Feb 25;5(1):e12032. doi: 10.2196/12032.

DOI:10.2196/12032
PMID:30801254
原文链接:https://pmc.ncbi.nlm.nih.gov/articles/PMC6409513/
Abstract

BACKGROUND

Information from historical infectious disease outbreaks provides real-world data about outbreaks and their impacts on affected populations. These data can be used to develop a picture of an unfolding outbreak in its early stages, when incoming information is sparse and isolated, to identify effective control measures and guide their implementation.

OBJECTIVE

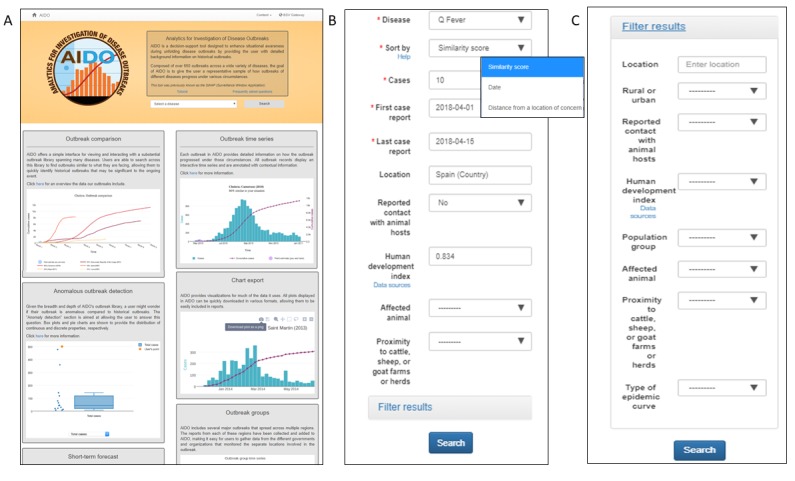
This study aimed to develop a publicly accessible Web-based visual analytic called Analytics for the Investigation of Disease Outbreaks (AIDO) that uses historical disease outbreak information for decision support and situational awareness of an unfolding outbreak.

METHODS

We developed an algorithm to allow the matching of unfolding outbreak data to a representative library of historical outbreaks. This process provides epidemiological clues that facilitate a user's understanding of an unfolding outbreak and facilitates informed decisions about mitigation actions. Disease-specific properties to build a complete picture of the unfolding event were identified through a data-driven approach. A method of analogs approach was used to develop a short-term forecasting feature in the analytic. The 4 major steps involved in developing this tool were (1) collection of historic outbreak data and preparation of the representative library, (2) development of AIDO algorithms, (3) development of user interface and associated visuals, and (4) verification and validation.

RESULTS

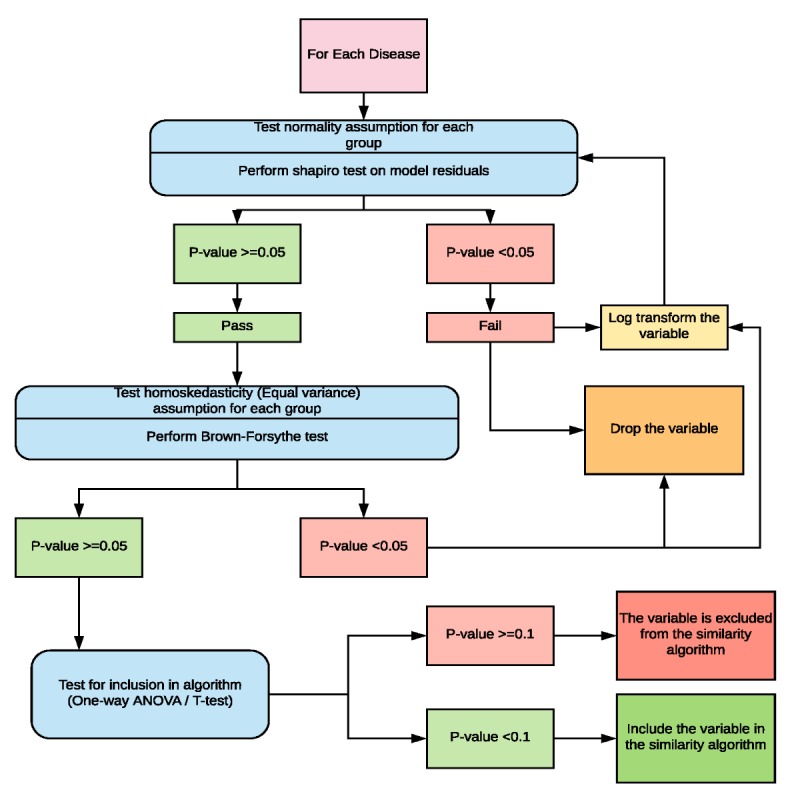
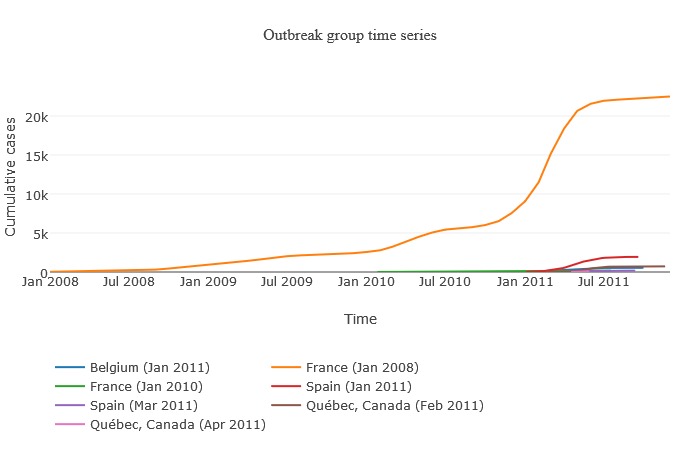
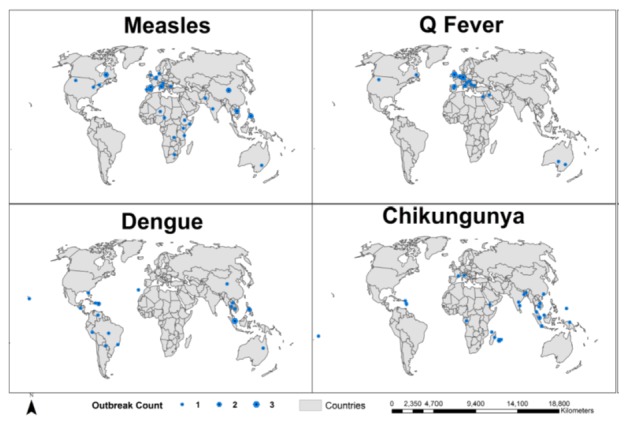
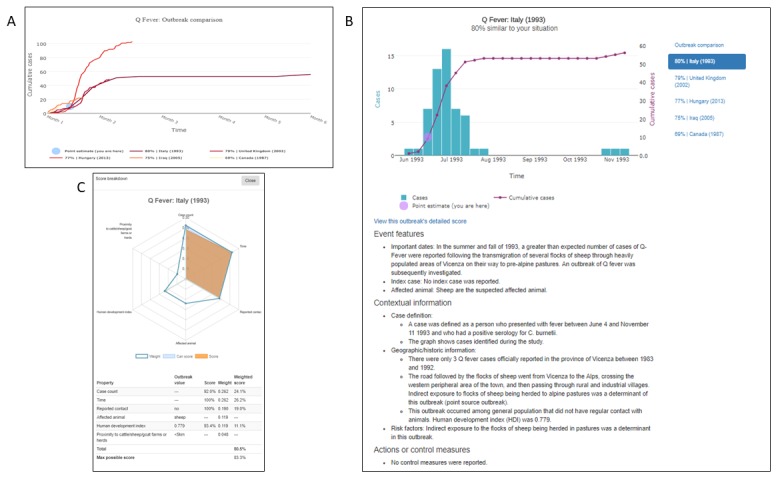
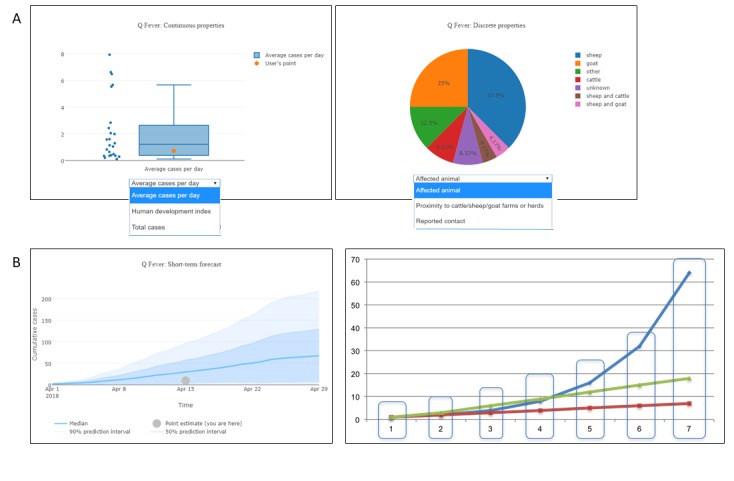
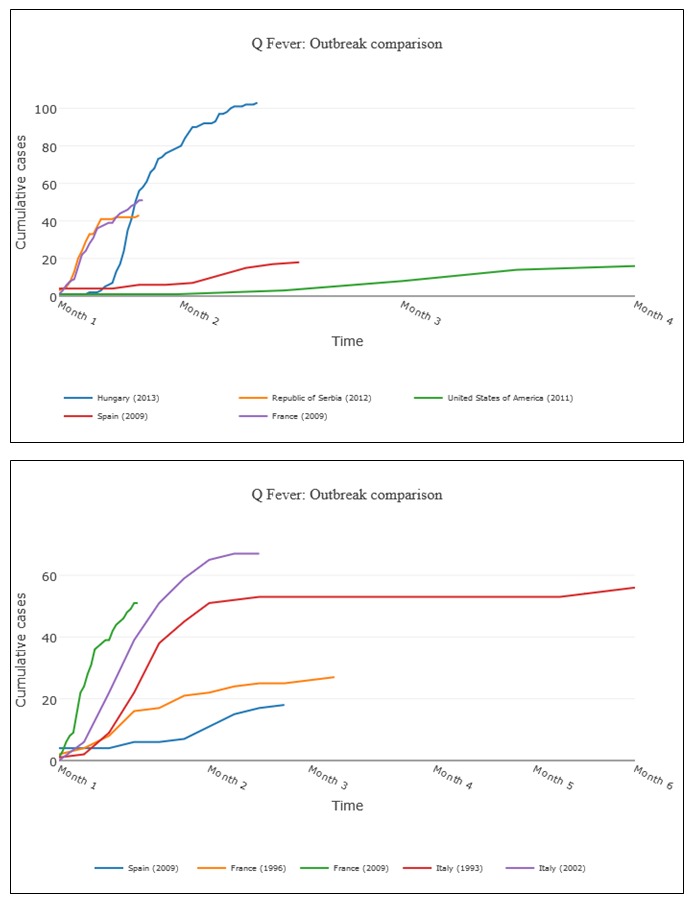
The tool currently includes representative historical outbreaks for 39 infectious diseases with over 600 diverse outbreaks. We identified 27 different properties categorized into 3 broad domains (population, location, and disease) that were used to evaluate outbreaks across all diseases for their effect on case count and duration of an outbreak. Statistical analyses revealed disease-specific properties from this set that were included in the disease-specific similarity algorithm. Although there were some similarities across diseases, we found that statistically important properties tend to vary, even between similar diseases. This may be because of our emphasis on including diverse representative outbreak presentations in our libraries. AIDO algorithm evaluations (similarity algorithm and short-term forecasting) were conducted using 4 case studies and we have shown details for the Q fever outbreak in Bilbao, Spain (2014), using data from the early stages of the outbreak. Using data from only the initial 2 weeks, AIDO identified historical outbreaks that were very similar in terms of their epidemiological picture (case count, duration, source of exposure, and urban setting). The short-term forecasting algorithm accurately predicted case count and duration for the unfolding outbreak.

CONCLUSIONS

AIDO is a decision support tool that facilitates increased situational awareness during an unfolding outbreak and enables informed decisions on mitigation strategies. AIDO analytics are available to epidemiologists across the globe with access to internet, at no cost. In this study, we presented a new approach to applying historical outbreak data to provide actionable information during the early stages of an unfolding infectious disease outbreak.

摘要

背景

历史上传染病爆发的信息提供了有关疫情爆发及其对受影响人群影响的真实数据。这些数据可用于在疫情爆发的早期阶段,当收到的信息稀少且孤立时,勾勒出疫情的发展态势,以确定有效的控制措施并指导其实施。

目的

本研究旨在开发一种名为疾病爆发调查分析工具(AIDO)的基于网络的公开可视化分析工具,该工具利用历史疾病爆发信息进行决策支持和对正在发生的疫情的态势感知。

方法

我们开发了一种算法,以便将正在发生的疫情数据与具有代表性的历史疫情库进行匹配。这一过程提供了流行病学线索,有助于用户理解正在发生的疫情,并有助于就缓解行动做出明智决策。通过数据驱动的方法确定了构建疫情发展全貌的特定疾病属性。采用类比法在分析工具中开发了短期预测功能。开发此工具涉及的4个主要步骤为:(1)收集历史疫情数据并准备代表性库;(2)开发AIDO算法;(3)开发用户界面及相关可视化;(4)验证与确认。

结果

该工具目前包括39种传染病的代表性历史疫情,有600多次不同的疫情。我们确定了27种不同的属性,分为3个广泛领域(人群、地点和疾病),用于评估所有疾病的疫情对病例数和疫情持续时间的影响。统计分析揭示了该集合中包含在特定疾病相似性算法中的特定疾病属性。尽管不同疾病之间存在一些相似之处,但我们发现,即使是相似疾病,具有统计学意义的属性也往往不同。这可能是因为我们强调在库中纳入各种具有代表性的疫情表现形式。使用4个案例研究对AIDO算法进行了评估(相似性算法和短期预测),我们展示了西班牙毕尔巴鄂(2014年)Q热疫情爆发早期阶段的数据细节。仅使用最初两周的数据,AIDO就识别出了在流行病学情况(病例数、持续时间、暴露源和城市环境)方面非常相似的历史疫情。短期预测算法准确预测了正在发生的疫情的病例数和持续时间。

结论

AIDO是一种决策支持工具,有助于在疫情爆发期间增强态势感知,并就缓解策略做出明智决策。全球各地能够访问互联网的流行病学家均可免费使用AIDO分析工具。在本研究中,我们提出了一种应用历史疫情数据的新方法,以便在传染病爆发的早期阶段提供可采取行动的信息。

https://cdn.ncbi.nlm.nih.gov/pmc/blobs/f61b/6409513/2f6384857c84/publichealth_v5i1e12032_fig7.jpg
https://cdn.ncbi.nlm.nih.gov/pmc/blobs/f61b/6409513/0bff60731485/publichealth_v5i1e12032_fig1.jpg
https://cdn.ncbi.nlm.nih.gov/pmc/blobs/f61b/6409513/22202fbc379f/publichealth_v5i1e12032_fig2.jpg
https://cdn.ncbi.nlm.nih.gov/pmc/blobs/f61b/6409513/ebd0cd19f92a/publichealth_v5i1e12032_fig3.jpg
https://cdn.ncbi.nlm.nih.gov/pmc/blobs/f61b/6409513/212c805381cf/publichealth_v5i1e12032_fig4.jpg
https://cdn.ncbi.nlm.nih.gov/pmc/blobs/f61b/6409513/a41438d82735/publichealth_v5i1e12032_fig5.jpg
https://cdn.ncbi.nlm.nih.gov/pmc/blobs/f61b/6409513/710b9b8700d8/publichealth_v5i1e12032_fig6.jpg
https://cdn.ncbi.nlm.nih.gov/pmc/blobs/f61b/6409513/2f6384857c84/publichealth_v5i1e12032_fig7.jpg

相似文献

1
Analytics for Investigation of Disease Outbreaks: Web-Based Analytics Facilitating Situational Awareness in Unfolding Disease Outbreaks.疾病爆发调查分析:基于网络的分析助力在疾病爆发过程中实现态势感知
JMIR Public Health Surveill. 2019 Feb 25;5(1):e12032. doi: 10.2196/12032.
2
ID-Viewer: a visual analytics architecture for infectious diseases surveillance and response management in Pakistan.ID-Viewer:巴基斯坦传染病监测与应对管理的可视化分析架构
Public Health. 2016 May;134:72-85. doi: 10.1016/j.puhe.2016.01.006. Epub 2016 Feb 13.
3
Warning Signs of Potential Black Swan Outbreaks in Infectious Disease.传染病潜在黑天鹅事件的警示信号。
Front Microbiol. 2022 Feb 24;13:845572. doi: 10.3389/fmicb.2022.845572. eCollection 2022.
4
Epinome: a visual-analytics workbench for epidemiology data.Epinome:一个用于流行病学数据的可视化分析工作台。
IEEE Comput Graph Appl. 2012 Mar-Apr;32(2):89-95. doi: 10.1109/MCG.2012.31.
5
Deep similarity analysis and forecasting of actual outbreak of major infectious diseases using Internet-Sourced data.利用互联网数据进行主要传染病实际疫情的深度相似性分析和预测。
J Biomed Inform. 2022 Sep;133:104148. doi: 10.1016/j.jbi.2022.104148. Epub 2022 Jul 22.
6
Surveillance for waterborne-disease outbreaks--United States, 1999-2000.1999 - 2000年美国水源性疾病暴发监测
MMWR Surveill Summ. 2002 Nov 22;51(8):1-47.
7
A Mobile App and Dashboard for Early Detection of Infectious Disease Outbreaks: Development Study.移动应用程序和仪表板用于传染病爆发的早期检测:开发研究。
JMIR Public Health Surveill. 2021 Mar 9;7(3):e14837. doi: 10.2196/14837.
8
Web platform using digital image processing and geographic information system tools: a Brazilian case study on dengue.使用数字图像处理和地理信息系统工具的网络平台:巴西登革热案例研究
Biomed Eng Online. 2015 Jul 16;14:69. doi: 10.1186/s12938-015-0052-2.
9
Infectious Diseases Seeker (IDS): An Innovative Tool for Prompt Identification of Infectious Diseases during Outbreaks.传染病搜索者(IDS):一种在疫情爆发期间快速识别传染病的创新工具。
Int J Environ Res Public Health. 2021 Mar 20;18(6):3216. doi: 10.3390/ijerph18063216.
10
Integrating malaria surveillance with climate data for outbreak detection and forecasting: the EPIDEMIA system.将疟疾监测与气候数据相结合以进行疫情检测和预测:EPIDEMIA系统。
Malar J. 2017 Feb 23;16(1):89. doi: 10.1186/s12936-017-1735-x.

引用本文的文献

1
Building a pathway to One Health surveillance and response in Asian countries.构建亚洲国家“同一健康”监测与应对的途径。
Sci One Health. 2024 Apr 2;3:100067. doi: 10.1016/j.soh.2024.100067. eCollection 2024.
2
Warning Signs of Potential Black Swan Outbreaks in Infectious Disease.传染病潜在黑天鹅事件的警示信号。
Front Microbiol. 2022 Feb 24;13:845572. doi: 10.3389/fmicb.2022.845572. eCollection 2022.
3
Improving Detection of Disease Re-emergence Using a Web-Based Tool (RED Alert): Design and Case Analysis Study.利用基于网络的工具(REd Alert)提高疾病再现检测:设计和案例分析研究。

本文引用的文献

1
Dengue: The break-bone fever outbreak in Kerala, India.登革热:印度喀拉拉邦的骨痛热症疫情。
Nepal J Epidemiol. 2017 Jun 30;7(2):666-669. doi: 10.3126/nje.v7i2.17972. eCollection 2017 Jun.
2
The 2017 Dhaka chikungunya outbreak.2017年达卡基孔肯雅热疫情。
Lancet Infect Dis. 2017 Nov;17(11):1118. doi: 10.1016/S1473-3099(17)30564-9.
3
A Comparative Evaluation of Unsupervised Anomaly Detection Algorithms for Multivariate Data.多元数据无监督异常检测算法的比较评估
JMIR Public Health Surveill. 2021 Jan 7;7(1):e24132. doi: 10.2196/24132.
PLoS One. 2016 Apr 19;11(4):e0152173. doi: 10.1371/journal.pone.0152173. eCollection 2016.
4
The Biosurveillance Analytics Resource Directory (BARD): Facilitating the Use of Epidemiological Models for Infectious Disease Surveillance.生物监测分析资源目录(BARD):促进将流行病学模型用于传染病监测
PLoS One. 2016 Jan 28;11(1):e0146600. doi: 10.1371/journal.pone.0146600. eCollection 2016.
5
Q Fever Outbreak among Workers at a Waste-Sorting Plant.一家垃圾分类厂工人中出现Q热疫情。
PLoS One. 2015 Sep 23;10(9):e0138817. doi: 10.1371/journal.pone.0138817. eCollection 2015.
6
Comparing timeliness, content, and disease severity of formal and informal source outbreak reporting.比较正式和非正式来源的疫情报告的及时性、内容和疾病严重程度。
BMC Infect Dis. 2015 Mar 20;15:135. doi: 10.1186/s12879-015-0885-0.
7
An updated natural history model of cervical cancer: derivation of model parameters.宫颈癌自然史更新模型:模型参数推导。
Am J Epidemiol. 2014 Sep 1;180(5):545-55. doi: 10.1093/aje/kwu159. Epub 2014 Jul 31.
8
The 2010 cholera outbreak in Haiti: how science solved a controversy.2010年海地霍乱疫情:科学如何解决一场争议。
PLoS Pathog. 2014 Apr 3;10(4):e1003967. doi: 10.1371/journal.ppat.1003967. eCollection 2014 Apr.
9
Cholera transmission dynamic models for public health practitioners.面向公共卫生从业者的霍乱传播动力学模型。
Emerg Themes Epidemiol. 2014 Feb 12;11(1):1. doi: 10.1186/1742-7622-11-1.
10
Contagious diseases in the United States from 1888 to the present.1888年至今美国的传染病
N Engl J Med. 2013 Nov 28;369(22):2152-8. doi: 10.1056/NEJMms1215400.