Zhou Qiang, Wu Zong-Yi, Lin Zhong-Qin
Department of Orthopedic Surgery, Wenzhou Hospital of Intergrated Traditional Chinese and Western Medicine, 75 Jinxiu Road, Wenzhou 325027, Zhejiang, China.
Department of Orthopaedic Surgery, Second Affiliated Hospital of Wenzhou Medical University, 109 Xueyuan Xi Road, Wenzhou 325027, Zhejiang, China.
J Bone Oncol. 2019 Feb 12;15:100223. doi: 10.1016/j.jbo.2019.100223. eCollection 2019 Apr.
This study was designed to develop a nomogram for assessing the survival of patients with Ewing sarcoma (ES).
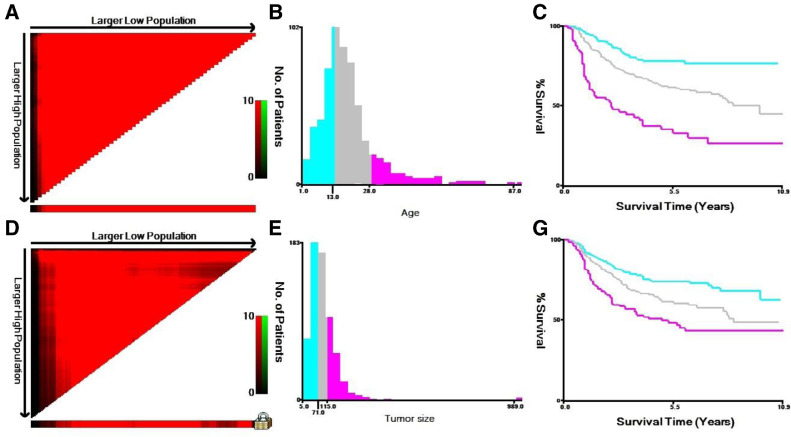
Data from patients diagnosed with ES between 2004 and 2013 were collected from the Surveillance, Epidemiology, and End Results (SEER) database. Based on patient registration, the primary cohort was divided into a training set ( = 479, data from 17 cancer registries) and a validation set ( = 137, data from 1 cancer registry). Then, the prognostic effects of variables were analyzed using Kaplan-Meier method and Cox proportional hazard model. Moreover, nomograms were established for estimating 3- and 5-year overall survival (OS) and cancer-special survival (CSS) based on Cox regression model. Last, nomogram was validated by training set and validation set.
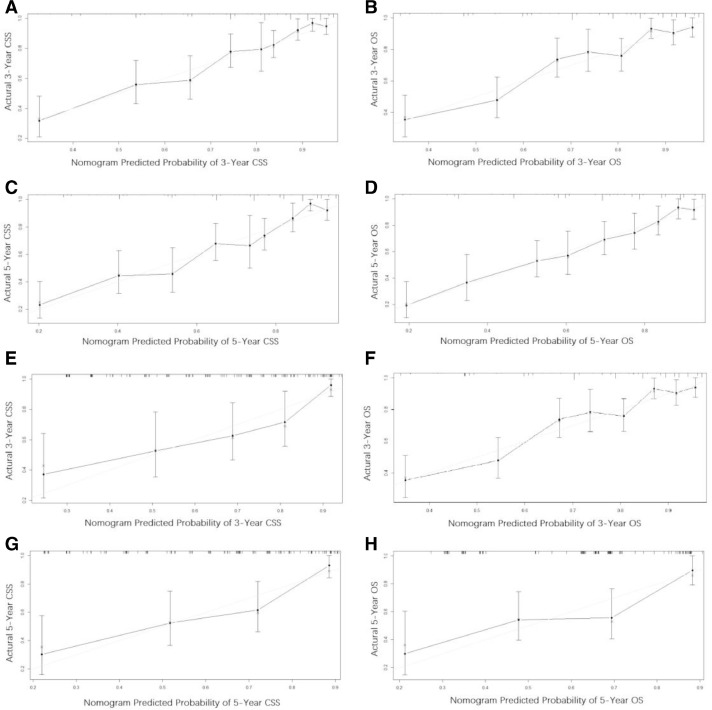
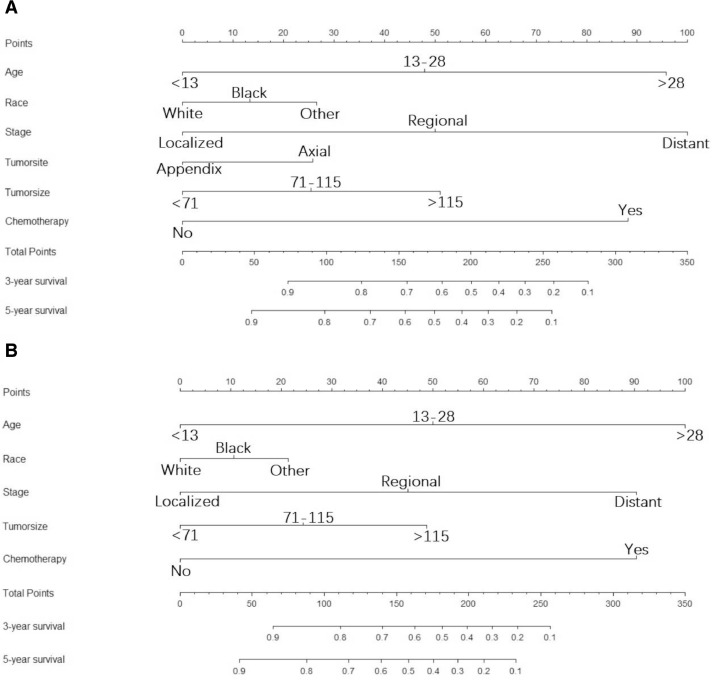
According to the multivariate analysis of training set, nomogram which combined age, race, stage, tumor site, tumor size and chemotherapy was identified. The internal bootstrap resampling approach suggested the nomogram had sufficient discriminatory power with the C-index of OS: 0.754 (95% CI, 0.705-0.802) and CSS: 0.759 (95% CI, 0.700-0.800). The calibration plots also demonstrated good consistence between the prediction and the observation.
Our nomogram is a reliable and powerful tool for distinguishing and predicting the survival of ES patients, thus helping to better select medical examinations and optimize treatment options in collaboration with medical oncologists and surgeons.
本研究旨在开发一种用于评估尤因肉瘤(ES)患者生存率的列线图。
从监测、流行病学和最终结果(SEER)数据库收集2004年至2013年期间诊断为ES的患者数据。根据患者登记情况,将主要队列分为训练集(n = 479,来自17个癌症登记处的数据)和验证集(n = 137,来自1个癌症登记处的数据)。然后,使用Kaplan-Meier法和Cox比例风险模型分析变量的预后效应。此外,基于Cox回归模型建立列线图以估计3年和5年总生存率(OS)和癌症特异性生存率(CSS)。最后,通过训练集和验证集对列线图进行验证。
根据训练集的多变量分析,确定了结合年龄、种族、分期、肿瘤部位、肿瘤大小和化疗的列线图。内部自举重采样方法表明,该列线图具有足够的区分能力,OS的C指数为0.754(95%CI,0.705 - 0.802),CSS的C指数为0.759(95%CI,0.700 - 0.800)。校准图也显示预测与观察之间具有良好的一致性。
我们的列线图是区分和预测ES患者生存率的可靠且强大的工具,从而有助于与医学肿瘤学家和外科医生更好地选择医学检查并优化治疗方案。