• 文献检索
  • 文档翻译
  • 深度研究
  • 学术资讯
  • Suppr Zotero 插件Zotero 插件
  • 邀请有礼
  • 套餐&价格
  • 历史记录
应用&插件
Suppr Zotero 插件Zotero 插件浏览器插件Mac 客户端Windows 客户端微信小程序
定价
高级版会员购买积分包购买API积分包
服务
文献检索文档翻译深度研究API 文档MCP 服务
关于我们
关于 Suppr公司介绍联系我们用户协议隐私条款
关注我们

Suppr 超能文献

核心技术专利:CN118964589B侵权必究
粤ICP备2023148730 号-1Suppr @ 2026

文献检索

告别复杂PubMed语法,用中文像聊天一样搜索,搜遍4000万医学文献。AI智能推荐,让科研检索更轻松。

立即免费搜索

文件翻译

保留排版,准确专业,支持PDF/Word/PPT等文件格式,支持 12+语言互译。

免费翻译文档

深度研究

AI帮你快速写综述,25分钟生成高质量综述,智能提取关键信息,辅助科研写作。

立即免费体验

埃塞俄比亚的能源和营养供应趋势:粮农组织粮食平衡表的观点。

Trends in energy and nutrient supply in Ethiopia: a perspective from FAO food balance sheets.

机构信息

School of Food and Nutritional Sciences, University College Cork, Cork, Republic of Ireland.

Department of Medicine, Faculty of Medicine and Dentistry, University of Alberta, 5-10 University Terrace, 8303-112 St, Edmonton, AB, T6G 2E1, Canada.

出版信息

Nutr J. 2019 Aug 13;18(1):46. doi: 10.1186/s12937-019-0471-1.

DOI:10.1186/s12937-019-0471-1
PMID:31409356
原文链接:https://pmc.ncbi.nlm.nih.gov/articles/PMC6693184/
Abstract

BACKGROUND

Ethiopia is the second-most populous country in Africa. Although most people still live in rural areas, the urban population is increasing. Generally, urbanisation is associated with a nutrition transition and an increase in risk factors for non-communicable diseases (NCDs). The objective of this study was to determine how the nutritional composition of the Ethiopian food supply has changed over the last 50 years and whether there is evidence of a nutrition transition.

METHODS

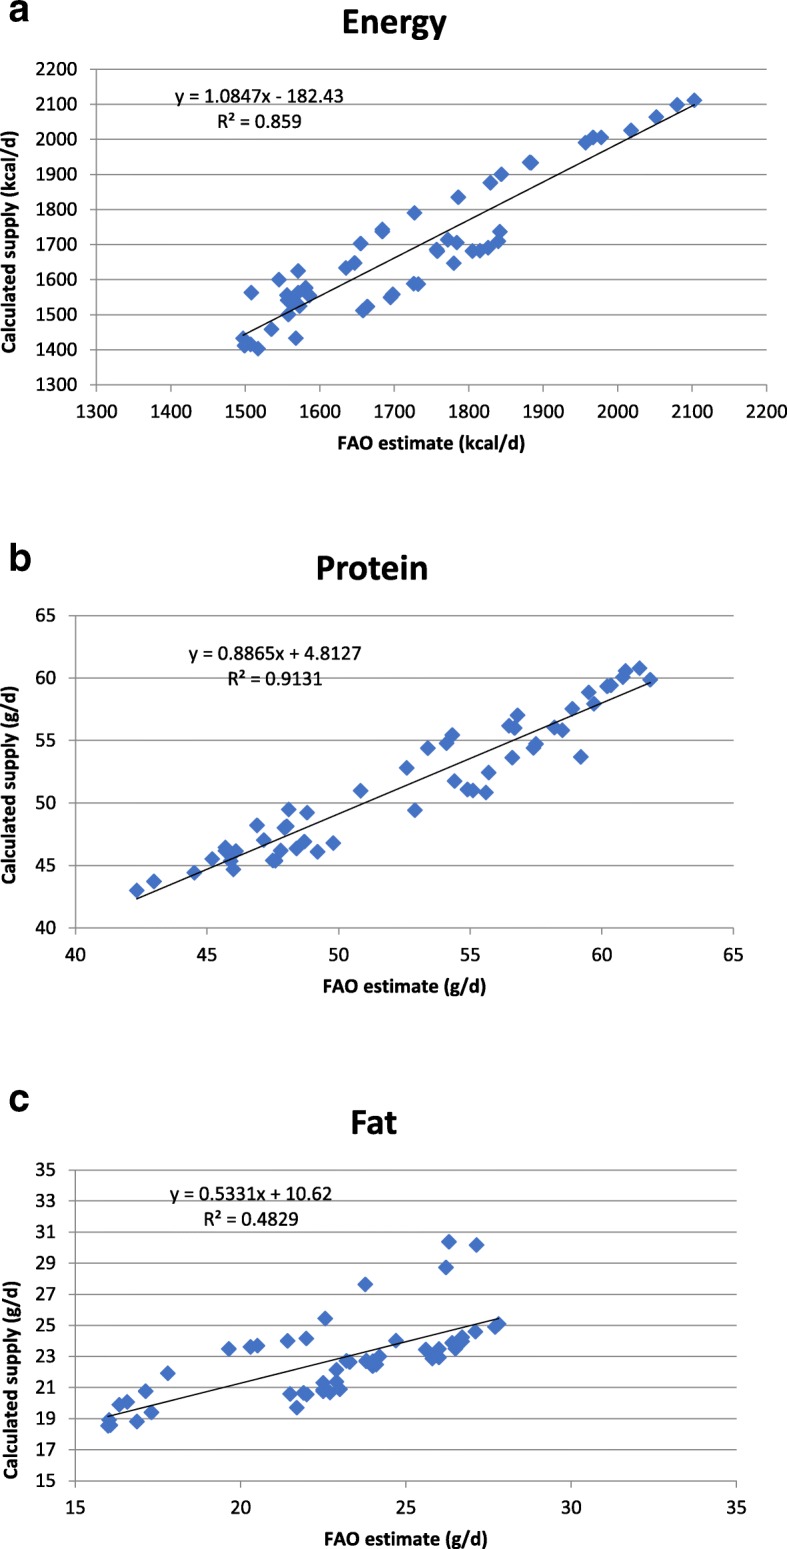
Food balance sheets for Ethiopia from 1961 to 2011 were downloaded from the FAOSTAT database and daily per capita supply for 17 commodity groupings was calculated. After appropriate coding, per capita energy and nutrient supplies were determined.

RESULTS

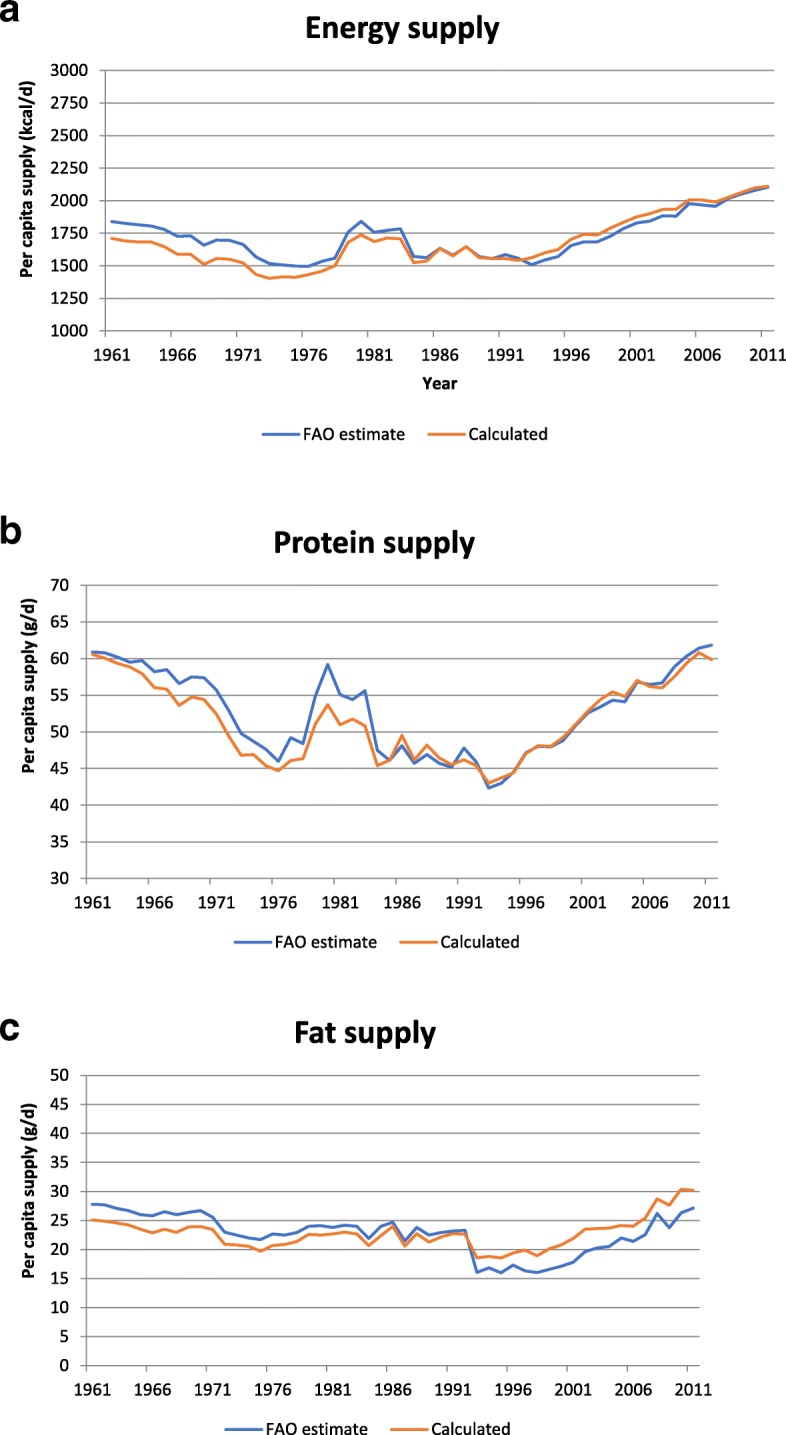
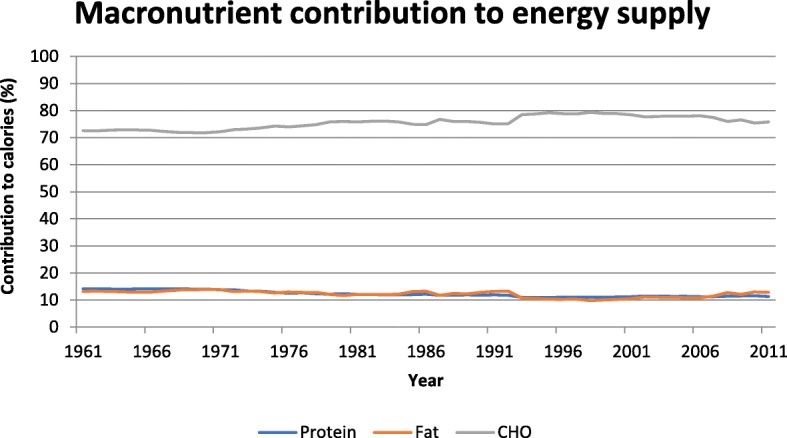
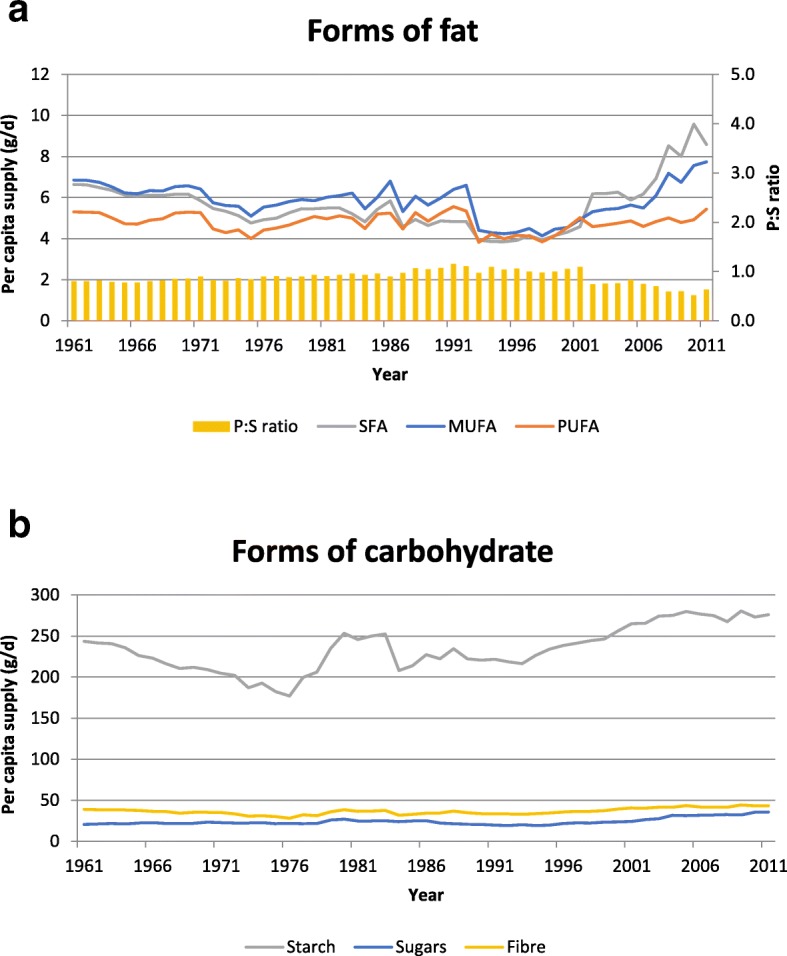
Per capita energy supply was 1710 kcal/d in 1961, fell to 1403 kcal/d by 1973, and increased to 2111 kcal/d in 2011. Carbohydrate was by far the greatest energy source throughout the period, ranging from 72% of energy in 1968 to 79% in 1998; however, this was mostly provided by complex carbohydrates as the contribution of sugars to energy only varied between 4.7% in 1994 and 6.7% in 2011. Energy from fat was low, ranging from 14% of energy in 1970 to 10% in 1998. Energy from protein ranged from 14% in 1962 to 11% in 1994. Per capita supplies of calcium, vitamin A, C, D, folate and other B-vitamins were insufficient and there was a low supply of animal foods.

CONCLUSIONS

The Ethiopian food supply is still remarkably high in complex carbohydrates and low in sugars, fat, protein, and micronutrients. There is little evidence yet of changes that are usually associated with a nutrition transition.

摘要

背景

埃塞俄比亚是非洲第二大人口大国。尽管大多数人仍居住在农村地区,但城市人口正在增加。一般来说,城市化与营养转型和非传染性疾病(NCD)风险因素的增加有关。本研究的目的是确定在过去 50 年中,埃塞俄比亚食物供应的营养成分发生了怎样的变化,以及是否存在营养转型的证据。

方法

从 FAOSTAT 数据库下载了 1961 年至 2011 年期间的埃塞俄比亚粮食平衡表,并计算了 17 种商品组别的人均日供应量。经过适当编码,确定了人均能量和营养素的供应量。

结果

1961 年,人均能量供应量为 1710 千卡/天,1973 年降至 1403 千卡/天,2011 年增至 2111 千卡/天。碳水化合物是整个时期最大的能量来源,范围从 1968 年的 72%到 1998 年的 79%;然而,这主要是由复杂碳水化合物提供的,因为糖在能量中的贡献仅在 1994 年的 4.7%和 2011 年的 6.7%之间变化。脂肪提供的能量较低,范围从 1970 年的 14%到 1998 年的 10%。蛋白质提供的能量范围从 1962 年的 14%到 1994 年的 11%。人均钙、维生素 A、C、D、叶酸和其他 B 族维生素的供应量不足,动物食品的供应量也很低。

结论

埃塞俄比亚的食物供应仍然以复杂碳水化合物为主,糖、脂肪、蛋白质和微量营养素含量较低。目前几乎没有证据表明发生了通常与营养转型相关的变化。

https://cdn.ncbi.nlm.nih.gov/pmc/blobs/cd5b/6693184/bad354ee2d46/12937_2019_471_Fig6_HTML.jpg
https://cdn.ncbi.nlm.nih.gov/pmc/blobs/cd5b/6693184/99e3cb7d9e61/12937_2019_471_Fig1_HTML.jpg
https://cdn.ncbi.nlm.nih.gov/pmc/blobs/cd5b/6693184/79e83ee1cabb/12937_2019_471_Fig2_HTML.jpg
https://cdn.ncbi.nlm.nih.gov/pmc/blobs/cd5b/6693184/085082120bc8/12937_2019_471_Fig3_HTML.jpg
https://cdn.ncbi.nlm.nih.gov/pmc/blobs/cd5b/6693184/d2563c66bcb0/12937_2019_471_Fig4_HTML.jpg
https://cdn.ncbi.nlm.nih.gov/pmc/blobs/cd5b/6693184/46e5d7ad3aea/12937_2019_471_Fig5_HTML.jpg
https://cdn.ncbi.nlm.nih.gov/pmc/blobs/cd5b/6693184/bad354ee2d46/12937_2019_471_Fig6_HTML.jpg

相似文献

1
Trends in energy and nutrient supply in Ethiopia: a perspective from FAO food balance sheets.埃塞俄比亚的能源和营养供应趋势:粮农组织粮食平衡表的观点。
Nutr J. 2019 Aug 13;18(1):46. doi: 10.1186/s12937-019-0471-1.
2
Trends in energy and nutrient supply in Trinidad and Tobago from 1961 to 2007 using FAO food balance sheets.特立尼达和多巴哥 1961 年至 2007 年的能源和营养素供应趋势,采用粮农组织粮食平衡表。
Public Health Nutr. 2013 Sep;16(9):1693-702. doi: 10.1017/S136898001200537X. Epub 2013 Jan 4.
3
The nutrition transition in Barbados: trends in macronutrient supply from 1961 to 2003.巴巴多斯的营养转型:1961 年至 2003 年主要营养素供应的趋势。
Br J Nutr. 2010 Oct;104(8):1222-9. doi: 10.1017/S0007114510002011. Epub 2010 May 26.
4
The nutrition transition in the Republic of Ireland: trends in energy and nutrient supply from 1961 to 2007 using Food and Agriculture Organization food balance sheets.爱尔兰共和国的营养转型:利用粮农组织食物平衡表分析 1961 年至 2007 年期间的能量和营养素供应趋势。
Br J Nutr. 2011 Oct;106(7):1078-89. doi: 10.1017/S0007114511001395. Epub 2011 Apr 12.
5
The nutrient content of the Italian food supply 1961-1992.1961 - 1992年意大利食品供应的营养成分
Eur J Clin Nutr. 1997 Apr;51(4):259-65. doi: 10.1038/sj.ejcn.1600395.
6
Nutrient intake from habitual oral diet in patients with severe short bowel syndrome living in the southeastern United States.居住在美国东南部的严重短肠综合征患者通过日常口服饮食的营养摄入情况。
Nutrition. 2008 Apr;24(4):330-9. doi: 10.1016/j.nut.2007.12.016.
7
Nutritional intakes in community-dwelling older Japanese adults: high intakes of energy and protein based on high consumption of fish, vegetables and fruits provide sufficient micronutrients.日本社区居住的老年成年人的营养摄入情况:基于鱼类、蔬菜和水果的高消费量,能量和蛋白质的高摄入量提供了充足的微量营养素。
J Nutr Sci Vitaminol (Tokyo). 2004 Jun;50(3):184-95. doi: 10.3177/jnsv.50.184.
8
Evaluating the African food supply against the nutrient intake goals set for preventing diet-related non-communicable diseases: 1990 to 2017 trend analysis.评估非洲食物供应与预防饮食相关非传染性疾病的营养摄入目标的差距:1990 年至 2017 年趋势分析。
PLoS One. 2021 Jan 11;16(1):e0245241. doi: 10.1371/journal.pone.0245241. eCollection 2021.
9
Food availability and consumption at national, household and individual levels: implications for food-based dietary guidelines development.国家、家庭和个人层面的食物供应与消费:对基于食物的膳食指南制定的影响。
Public Health Nutr. 2001 Apr;4(2B):673-6. doi: 10.1079/phn2001152.
10
Food supply versus household survey data: nutrient consumption trends for Spain, 1958-1988.食物供应与家庭调查数据:1958 - 1988年西班牙的营养消费趋势
Eur J Epidemiol. 1996 Aug;12(4):367-71. doi: 10.1007/BF00145299.

引用本文的文献

1
Energy and Nutrient Intake Gaps and Socioeconomic Determinants of Ultra-Processed and Less-Processed Foods Consumed in Ethiopia: Evidence from National Food Consumption Survey.埃塞俄比亚超加工和低加工食品的能量与营养摄入差距及社会经济决定因素:来自全国食品消费调查的证据
Nutrients. 2025 Aug 29;17(17):2818. doi: 10.3390/nu17172818.
2
Association between dietary Intake, eating behavior, and childhood obesity among children and adolescents in Ethiopia.埃塞俄比亚儿童和青少年的饮食摄入、饮食行为与儿童肥胖之间的关联。
BMJ Nutr Prev Health. 2023 Nov 15;6(2):203-211. doi: 10.1136/bmjnph-2021-000415. eCollection 2023.
3
Comparison of Cardiovascular Health Profiles Across Population Surveys From 5 High- to Low-Income Countries.

本文引用的文献

1
Food composition tables in resource-poor settings: exploring current limitations and opportunities, with a focus on animal-source foods in sub-Saharan Africa.资源匮乏地区的食物成分表:探索当前的局限性与机遇,重点关注撒哈拉以南非洲的动物源食物。
Br J Nutr. 2016 Nov 28;116(10):1709-1719. doi: 10.1017/S0007114516003706. Epub 2016 Nov 8.
2
Global, regional, and national comparative risk assessment of 79 behavioural, environmental and occupational, and metabolic risks or clusters of risks, 1990-2015: a systematic analysis for the Global Burden of Disease Study 2015.1990 - 2015年79种行为、环境与职业及代谢风险或风险群组的全球、区域和国家比较风险评估:全球疾病负担研究2015的系统分析
Lancet. 2016 Oct 8;388(10053):1659-1724. doi: 10.1016/S0140-6736(16)31679-8.
3
来自5个高收入和低收入国家的人群调查中心血管健康状况的比较。
CJC Open. 2023 Dec 4;6(3):582-596. doi: 10.1016/j.cjco.2023.11.021. eCollection 2024 Mar.
4
Examining energy and nutrient production across the different agroecological zones in rural Ethiopia using statistical methods.运用统计方法研究埃塞俄比亚农村不同农业生态区的能源和养分生产情况。
Food Sci Nutr. 2023 Sep 15;11(12):7565-7580. doi: 10.1002/fsn3.3676. eCollection 2023 Dec.
5
Dietary pattern and other factors of breast cancer among women: a case control study in Northwest Ethiopia.饮食模式和其他因素与女性乳腺癌的关系:来自埃塞俄比亚西北部的一项病例对照研究。
BMC Cancer. 2023 Nov 1;23(1):1050. doi: 10.1186/s12885-023-11501-1.
6
Assessing the per Capita Food Supply Trends of 38 OECD Countries between 2000 and 2019-A Joinpoint Regression Analysis.评估2000年至2019年间38个经合组织国家的人均食品供应趋势——一项Joinpoint回归分析。
Life (Basel). 2023 Apr 27;13(5):1091. doi: 10.3390/life13051091.
7
Evolution of energy and nutrient supply in Zambia (1961-2013) in the context of policy, political, social, economic, and climatic changes.赞比亚(1961 - 2013年)在政策、政治、社会、经济及气候变化背景下的能源与营养供应演变
Food Secur. 2023;15(2):323-342. doi: 10.1007/s12571-022-01329-1. Epub 2022 Nov 22.
8
Food environment around schools and adolescent consumption of unhealthy foods in Addis Ababa, Ethiopia.埃塞俄比亚亚的斯亚贝巴学校周边的食物环境与青少年对不健康食品的消费
Matern Child Nutr. 2025 Jul;21 Suppl 1:e13415. doi: 10.1111/mcn.13415. Epub 2023 Mar 31.
9
Establishing Height-for-Age Z-Score Growth Reference Curves and Stunting Prevalence in Children and Adolescents in Pakistan.建立巴基斯坦儿童和青少年身高年龄 Z 评分生长参考曲线和发育迟缓患病率。
Int J Environ Res Public Health. 2022 Oct 3;19(19):12630. doi: 10.3390/ijerph191912630.
10
Factors associated with modern contraceptive demands satisfied among currently married/in-union women of reproductive age in Ethiopia: a multilevel analysis of the 2016 Demographic and Health Survey.埃塞俄比亚育龄已婚/同居妇女现代避孕需求满足的相关因素:对 2016 年人口与健康调查的多水平分析。
BMJ Open. 2022 Feb 2;12(2):e049341. doi: 10.1136/bmjopen-2021-049341.
Trends in energy and nutrient supply in Trinidad and Tobago from 1961 to 2007 using FAO food balance sheets.特立尼达和多巴哥 1961 年至 2007 年的能源和营养素供应趋势,采用粮农组织粮食平衡表。
Public Health Nutr. 2013 Sep;16(9):1693-702. doi: 10.1017/S136898001200537X. Epub 2013 Jan 4.
4
Dietary patterns, nutrient intake, and sociodemographic characteristics in HIV-infected Tanzanian pregnant women.坦桑尼亚感染艾滋病毒的孕妇的饮食模式、营养摄入和社会人口学特征
Ecol Food Nutr. 2013;52(1):34-62. doi: 10.1080/03670244.2012.705768.
5
Micronutrient levels and nutritional status of school children living in Northwest Ethiopia.生活在埃塞俄比亚西北部的学童的微量营养素水平和营养状况。
Nutr J. 2012 Dec 13;11:108. doi: 10.1186/1475-2891-11-108.
6
Nutritional status and dietary intake of urban residents in Gondar, Northwest Ethiopia.埃塞俄比亚西北部贡德尔市居民的营养状况和饮食摄入。
BMC Public Health. 2012 Sep 7;12:752. doi: 10.1186/1471-2458-12-752.
7
The nutrition transition in Africa: can it be steered into a more positive direction?非洲的营养转型:能否引导其朝更积极的方向发展?
Nutrients. 2011 Apr;3(4):429-41. doi: 10.3390/nu3040429. Epub 2011 Apr 11.
8
Global nutrition transition and the pandemic of obesity in developing countries.全球营养转型与发展中国家肥胖症流行。
Nutr Rev. 2012 Jan;70(1):3-21. doi: 10.1111/j.1753-4887.2011.00456.x.
9
The nutrition transition in the Republic of Ireland: trends in energy and nutrient supply from 1961 to 2007 using Food and Agriculture Organization food balance sheets.爱尔兰共和国的营养转型:利用粮农组织食物平衡表分析 1961 年至 2007 年期间的能量和营养素供应趋势。
Br J Nutr. 2011 Oct;106(7):1078-89. doi: 10.1017/S0007114511001395. Epub 2011 Apr 12.
10
The nutrition transition in Barbados: trends in macronutrient supply from 1961 to 2003.巴巴多斯的营养转型:1961 年至 2003 年主要营养素供应的趋势。
Br J Nutr. 2010 Oct;104(8):1222-9. doi: 10.1017/S0007114510002011. Epub 2010 May 26.