• 文献检索
  • 文档翻译
  • 深度研究
  • 学术资讯
  • Suppr Zotero 插件Zotero 插件
  • 邀请有礼
  • 套餐&价格
  • 历史记录
应用&插件
Suppr Zotero 插件Zotero 插件浏览器插件Mac 客户端Windows 客户端微信小程序
定价
高级版会员购买积分包购买API积分包
服务
文献检索文档翻译深度研究API 文档MCP 服务
关于我们
关于 Suppr公司介绍联系我们用户协议隐私条款
关注我们

Suppr 超能文献

核心技术专利:CN118964589B侵权必究
粤ICP备2023148730 号-1Suppr @ 2026

文献检索

告别复杂PubMed语法,用中文像聊天一样搜索,搜遍4000万医学文献。AI智能推荐,让科研检索更轻松。

立即免费搜索

文件翻译

保留排版,准确专业,支持PDF/Word/PPT等文件格式,支持 12+语言互译。

免费翻译文档

深度研究

AI帮你快速写综述,25分钟生成高质量综述,智能提取关键信息,辅助科研写作。

立即免费体验

澳大利亚癌症地图集的开发:估计的空间建模、可视化和报告。

Development of the Australian Cancer Atlas: spatial modelling, visualisation, and reporting of estimates.

机构信息

ARC Centre of Excellence for Mathematical and Statistical Frontiers, Queensland University of Technology (QUT), Brisbane, Australia.

School of Mathematics, Science and Engineering Faculty, Queensland University of Technology (QUT), Brisbane, Australia.

出版信息

Int J Health Geogr. 2019 Oct 1;18(1):21. doi: 10.1186/s12942-019-0185-9.

DOI:10.1186/s12942-019-0185-9
PMID:31570101
原文链接:https://pmc.ncbi.nlm.nih.gov/articles/PMC6771109/
Abstract

BACKGROUND

It is well known that the burden caused by cancer can vary geographically, which may relate to differences in health, economics or lifestyle. However, to date, there was no comprehensive picture of how the cancer burden, measured by cancer incidence and survival, varied by small geographical area across Australia.

METHODS

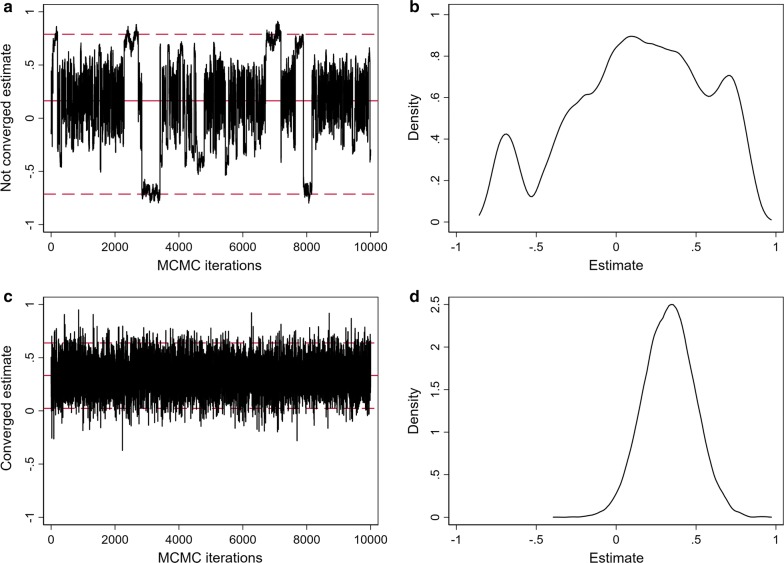
The Atlas consists of 2148 Statistical Areas level 2 across Australia defined by the Australian Statistical Geography Standard which provide the best compromise between small population and small area. Cancer burden was estimated for males, females, and persons separately, with 50 unique sex-specific (males, females, all persons) cancer types analysed. Incidence and relative survival were modelled with Bayesian spatial models using the Leroux prior which was carefully selected to provide adequate spatial smoothing while reflecting genuine geographic variation. Markov Chain Monte Carlo estimation was used because it facilitates quantifying the uncertainty of the posterior estimates numerically and visually.

RESULTS

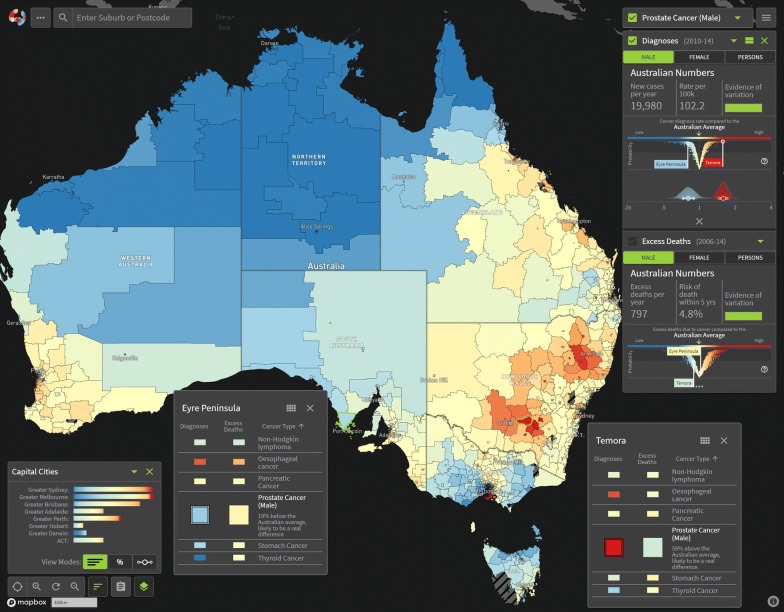
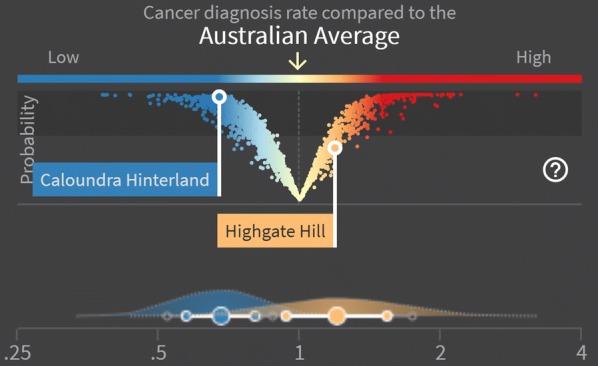
The results of the statistical model and visualisation development were published through the release of the Australian Cancer Atlas ( https://atlas.cancer.org.au ) in September, 2018. The Australian Cancer Atlas provides the first freely available, digital, interactive picture of cancer incidence and survival at the small geographical level across Australia with a focus on incorporating uncertainty, while also providing the tools necessary for accurate estimation and appropriate interpretation and decision making.

CONCLUSIONS

The success of the Atlas will be measured by how widely it is used by key stakeholders to guide research and inform decision making. It is hoped that the Atlas and the methodology behind it motivates new research opportunities that lead to improvements in our understanding of the geographical patterns of cancer burden, possible causes or risk factors, and the reasons for differences in variation between cancer types, both within Australia and globally. Future versions of the Atlas are planned to include new data sources to include indicators such as cancer screening and treatment, and extensions to the statistical methods to incorporate changes in geographical patterns over time.

摘要

背景

众所周知,癌症负担在地理上存在差异,这可能与健康、经济或生活方式的差异有关。然而,迄今为止,还没有一幅全面的画面来展示澳大利亚各地小地理区域的癌症负担(以癌症发病率和生存率衡量)是如何变化的。

方法

该图谱由澳大利亚统计局标准定义的澳大利亚 2148 个统计区 2 级组成,这些统计区在小人口和小面积之间提供了最佳的平衡。男性、女性和所有人的癌症负担分别进行了估计,分析了 50 种独特的性别特异性(男性、女性、所有人)癌症类型。发病率和相对生存率采用贝叶斯空间模型进行建模,使用 Leroux 先验,该先验经过精心选择,可在提供充分空间平滑的同时反映真实的地理变化。马尔可夫链蒙特卡罗估计用于量化后验估计的不确定性数值和可视化。

结果

统计模型和可视化开发的结果于 2018 年 9 月通过发布澳大利亚癌症图谱(https://atlas.cancer.org.au)发布。澳大利亚癌症图谱提供了澳大利亚各地小地理区域癌症发病率和生存率的第一个免费、数字、交互式图片,重点是纳入不确定性,同时还提供了准确估计和适当解释和决策所需的工具。

结论

该图谱的成功将通过关键利益相关者广泛使用它来指导研究和为决策提供信息来衡量。希望该图谱及其背后的方法激发新的研究机会,从而提高我们对癌症负担的地理模式、可能的原因或风险因素以及癌症类型之间差异变化的原因的理解,无论是在澳大利亚还是在全球范围内。未来版本的图谱计划包括新的数据源,以包括癌症筛查和治疗等指标,并扩展统计方法,以纳入随时间变化的地理模式变化。

https://cdn.ncbi.nlm.nih.gov/pmc/blobs/5b60/6771109/f6f83dbd4bcc/12942_2019_185_Fig5_HTML.jpg
https://cdn.ncbi.nlm.nih.gov/pmc/blobs/5b60/6771109/6b5f1055ec85/12942_2019_185_Fig1_HTML.jpg
https://cdn.ncbi.nlm.nih.gov/pmc/blobs/5b60/6771109/f8377e4a04f3/12942_2019_185_Fig2_HTML.jpg
https://cdn.ncbi.nlm.nih.gov/pmc/blobs/5b60/6771109/8478c914da92/12942_2019_185_Fig3_HTML.jpg
https://cdn.ncbi.nlm.nih.gov/pmc/blobs/5b60/6771109/a4e7a5c13484/12942_2019_185_Fig4_HTML.jpg
https://cdn.ncbi.nlm.nih.gov/pmc/blobs/5b60/6771109/f6f83dbd4bcc/12942_2019_185_Fig5_HTML.jpg

相似文献

1
Development of the Australian Cancer Atlas: spatial modelling, visualisation, and reporting of estimates.澳大利亚癌症地图集的开发:估计的空间建模、可视化和报告。
Int J Health Geogr. 2019 Oct 1;18(1):21. doi: 10.1186/s12942-019-0185-9.
2
Mapping the prevalence of cancer risk factors at the small area level in Australia.在澳大利亚的小区域层面绘制癌症风险因素的流行情况图。
Int J Health Geogr. 2023 Dec 19;22(1):37. doi: 10.1186/s12942-023-00352-5.
3
Assessment and statistical modeling of the relationship between remotely sensed aerosol optical depth and PM2.5 in the eastern United States.美国东部地区遥感气溶胶光学厚度与PM2.5之间关系的评估及统计建模
Res Rep Health Eff Inst. 2012 May(167):5-83; discussion 85-91.
4
Multivariate Bayesian meta-analysis: joint modelling of multiple cancer types using summary statistics.多变量贝叶斯荟萃分析:使用汇总统计数据对多种癌症类型进行联合建模。
Int J Health Geogr. 2020 Oct 17;19(1):42. doi: 10.1186/s12942-020-00234-0.
5
Bayesian spatial modelling of early childhood development in Australian regions.澳大利亚区域儿童早期发展的贝叶斯空间建模。
Int J Health Geogr. 2020 Oct 19;19(1):43. doi: 10.1186/s12942-020-00237-x.
6
[The cartographic depiction of regional variation in morbidity : Data analysis options using the example of the small-scale cancer atlas for Schleswig-Holstein].[发病率区域差异的地图描绘:以石勒苏益格-荷尔斯泰因州小型癌症地图集为例的数据分析选项]
Bundesgesundheitsblatt Gesundheitsforschung Gesundheitsschutz. 2017 Dec;60(12):1319-1327. doi: 10.1007/s00103-017-2651-5.
7
Designing the Australian Cancer Atlas: visualizing geostatistical model uncertainty for multiple audiences.设计澳大利亚癌症地图集:为多个受众可视化地质统计学模型不确定性。
J Am Med Inform Assoc. 2024 Nov 1;31(11):2447-2454. doi: 10.1093/jamia/ocae212.
8
Italian cancer figures--Report 2015: The burden of rare cancers in Italy.意大利癌症数据——2015年报告:意大利罕见癌症的负担
Epidemiol Prev. 2016 Jan-Feb;40(1 Suppl 2):1-120. doi: 10.19191/EP16.1S2.P001.035.
9
Geographical and spatial disparities in the incidence and survival of rare cancers in Australia.澳大利亚罕见癌症发病率和生存率的地域和空间差异。
Int J Cancer. 2023 Apr 15;152(8):1601-1612. doi: 10.1002/ijc.34395. Epub 2022 Dec 21.
10
Making the most of spatial information in health: a tutorial in Bayesian disease mapping for areal data.充分利用健康领域的空间信息:区域数据贝叶斯疾病映射教程
Geospat Health. 2016 May 31;11(2):428. doi: 10.4081/gh.2016.428.

引用本文的文献

1
Evaluating the impact of the Modifiable Areal Unit Problem on ecological model inference: A case study of COVID-19 data in Queensland, Australia.评估可修改区域单元问题对生态模型推断的影响:以澳大利亚昆士兰州的新冠肺炎数据为例
Infect Dis Model. 2025 May 10;10(3):1002-1019. doi: 10.1016/j.idm.2025.05.003. eCollection 2025 Sep.
2
Identifying Rural Hotspots for Head and Neck Cancer Using the Bayesian Mapping Approach.使用贝叶斯映射方法识别头颈癌的农村热点地区。
Cancers (Basel). 2025 Feb 26;17(5):819. doi: 10.3390/cancers17050819.
3
Latent Archetypes of the Spatial Patterns of Cancer.

本文引用的文献

1
Neighbourhood disadvantage, geographic remoteness and body mass index among immigrants to Australia: A national cohort study 2006-2014.澳大利亚移民中的邻里劣势、地理偏远与体重指数:一项2006 - 2014年的全国队列研究
PLoS One. 2018 Jan 23;13(1):e0191729. doi: 10.1371/journal.pone.0191729. eCollection 2018.
2
Spatial smoothing in Bayesian models: a comparison of weights matrix specifications and their impact on inference.贝叶斯模型中的空间平滑:权重矩阵规范的比较及其对推断的影响。
Int J Health Geogr. 2017 Dec 16;16(1):47. doi: 10.1186/s12942-017-0120-x.
3
Inequalities in Life Expectancy Among US Counties, 1980 to 2014: Temporal Trends and Key Drivers.
癌症空间模式的潜在原型。
Stat Med. 2024 Nov 30;43(27):5115-5137. doi: 10.1002/sim.10232. Epub 2024 Oct 3.
4
Long-Term Effect of Temperature Increase on Liver Cancer in Australia: A Bayesian Spatial Analysis.澳大利亚温度升高对肝癌的长期影响:贝叶斯空间分析。
Environ Health Perspect. 2024 Sep;132(9):97007. doi: 10.1289/EHP14574. Epub 2024 Sep 13.
5
Designing the Australian Cancer Atlas: visualizing geostatistical model uncertainty for multiple audiences.设计澳大利亚癌症地图集:为多个受众可视化地质统计学模型不确定性。
J Am Med Inform Assoc. 2024 Nov 1;31(11):2447-2454. doi: 10.1093/jamia/ocae212.
6
Mapping the prevalence of cancer risk factors at the small area level in Australia.在澳大利亚的小区域层面绘制癌症风险因素的流行情况图。
Int J Health Geogr. 2023 Dec 19;22(1):37. doi: 10.1186/s12942-023-00352-5.
7
Disease mapping: Geographic differences in population rates of interventional treatment for prostate cancer in Australia.疾病制图:澳大利亚前列腺癌介入治疗人群率的地理差异。
PLoS One. 2023 Nov 13;18(11):e0293954. doi: 10.1371/journal.pone.0293954. eCollection 2023.
8
Geographical and spatial variations in bowel cancer screening participation, Australia, 2015-2020.澳大利亚 2015-2020 年结直肠癌筛查参与的地域和空间差异。
PLoS One. 2023 Jul 20;18(7):e0288992. doi: 10.1371/journal.pone.0288992. eCollection 2023.
9
Investigation of Geographical Disparities: The Use of An Interpolation Method For Cancer Registry Data.地理差异调查:癌症登记数据插值方法的应用
J Okla State Med Assoc. 2023 Mar-Apr;116(2):62-71.
10
Being Bayesian in the 2020s: opportunities and challenges in the practice of modern applied Bayesian statistics.21 世纪的贝叶斯主义者:现代应用贝叶斯统计学实践中的机遇与挑战。
Philos Trans A Math Phys Eng Sci. 2023 May 15;381(2247):20220156. doi: 10.1098/rsta.2022.0156. Epub 2023 Mar 27.
1980年至2014年美国各县预期寿命的不平等:时间趋势和主要驱动因素
JAMA Intern Med. 2017 Jul 1;177(7):1003-1011. doi: 10.1001/jamainternmed.2017.0918.
4
Use of geographic indicators of healthcare, environment and socioeconomic factors to characterize environmental health disparities.利用医疗保健、环境和社会经济因素的地理指标来描述环境健康差异。
Environ Health. 2016 Jul 22;15(1):79. doi: 10.1186/s12940-016-0163-7.
5
A systematic review of inequalities in psychosocial outcomes for women with breast cancer according to residential location and Indigenous status in Australia.一项关于澳大利亚乳腺癌女性患者心理社会结局方面基于居住地点和原住民身份的不平等现象的系统评价。
Psychooncology. 2016 Oct;25(10):1157-1167. doi: 10.1002/pon.4124. Epub 2016 Mar 14.
6
Geographic disparities in prostate cancer outcomes--review of international patterns.前列腺癌治疗结果的地区差异——国际模式综述
Asian Pac J Cancer Prev. 2015;16(3):1259-75. doi: 10.7314/apjcp.2015.16.3.1259.
7
A history and critique of U.S. mortality atlases.美国死亡率地图集的历史与评论
Spat Spatiotemporal Epidemiol. 2009 Oct-Dec;1(1):3-17. doi: 10.1016/j.sste.2009.07.004. Epub 2009 Jul 30.
8
Adjusting for sampling variability in sparse data: geostatistical approaches to disease mapping.调整稀疏数据中的抽样变异性:疾病制图的地质统计学方法。
Int J Health Geogr. 2011 Oct 6;10:54. doi: 10.1186/1476-072X-10-54.
9
Developing the atlas of cancer in Queensland: methodological issues.昆士兰州癌症图谱的开发:方法学问题。
Int J Health Geogr. 2011 Jan 24;10:9. doi: 10.1186/1476-072X-10-9.
10
Spatial variation in prostate cancer survival in the Northern and Yorkshire region of England using Bayesian relative survival smoothing.利用贝叶斯相对生存平滑法研究英格兰北部和约克郡地区前列腺癌生存率的空间差异。
Br J Cancer. 2008 Dec 2;99(11):1786-93. doi: 10.1038/sj.bjc.6604757. Epub 2008 Nov 4.