.
Invest Ophthalmol Vis Sci. 2020 Jan 23;61(1):2. doi: 10.1167/iovs.61.1.2.
To determine the impact of topographic locations on the progression rate of geographic atrophy (GA).
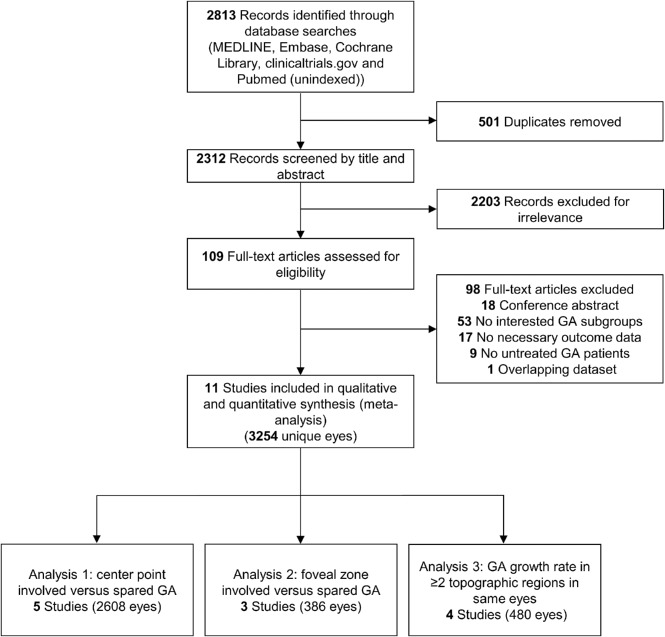
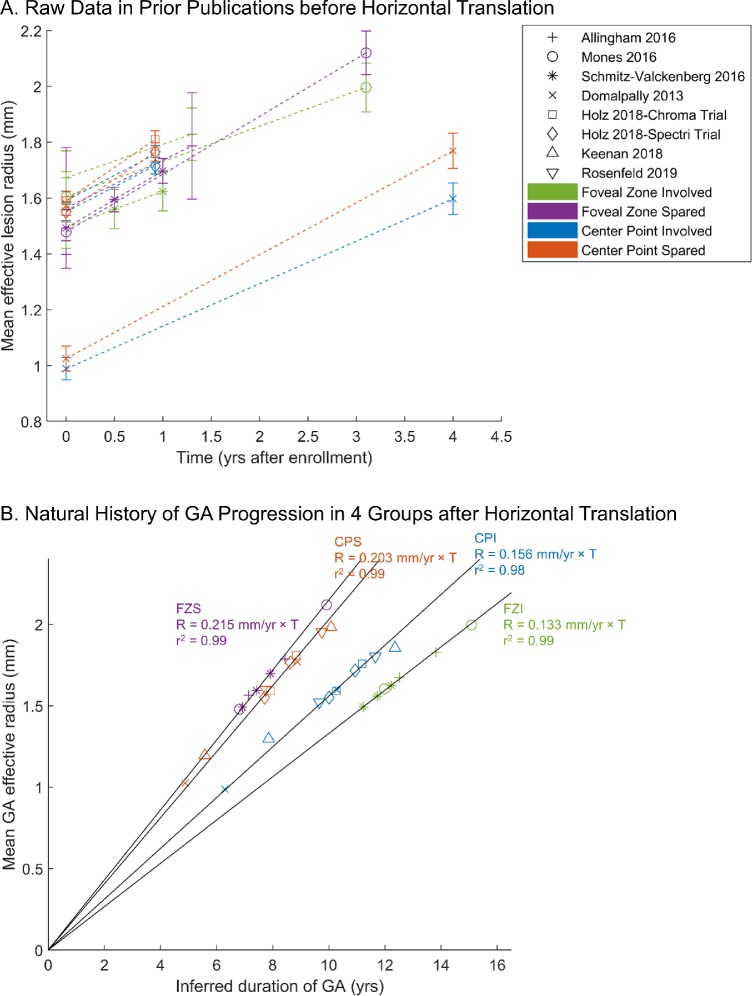
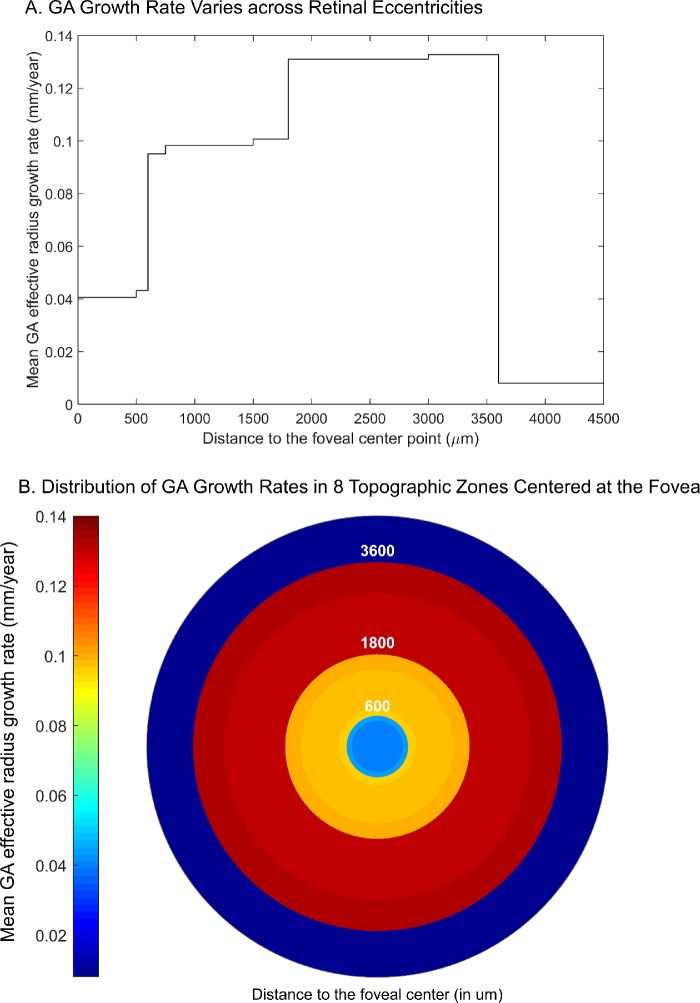
We searched in five literature databases up to May 3, 2019, for studies that evaluated the growth rates of GA lesions at different retinal regions. We performed random-effects meta-analyses to determine and compare the GA effective radius growth rates in four location groups defined by two separate classification schemes: (1) macular center point involved (CPI) or spared (CPS) in classification 1, and (2) foveal zone involved (FZI) or spared (FZS) in classification 2. We then estimated the GA growth rate in eight topographic zones and used the data to model the GA expansion.
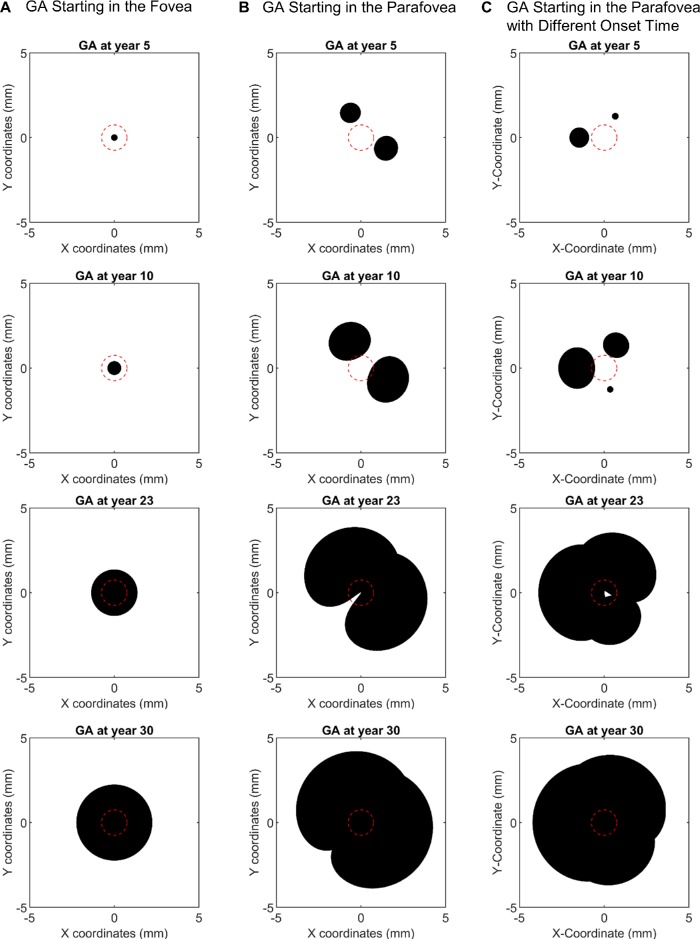
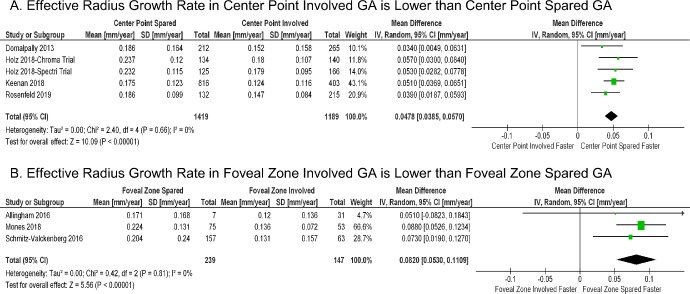
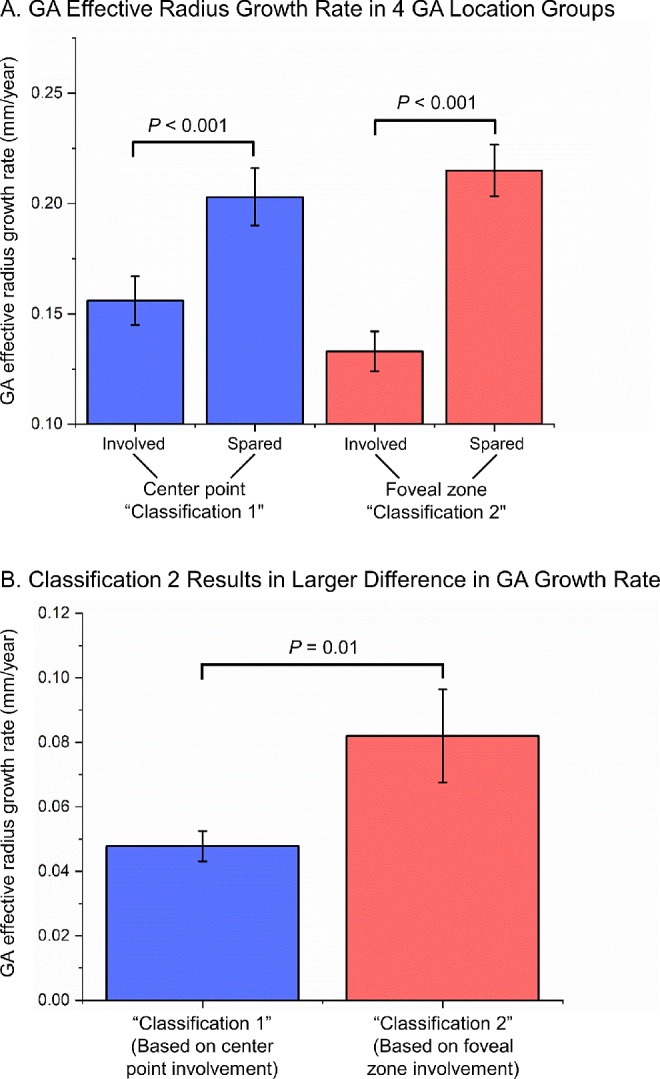
We included 11 studies with 3254 unique eyes. In studies that used classification 1, the effective radius growth rate was 30.1% higher in the CPS group (0.203 ± 0.013 mm/year) than in the CPI group (0.156 ± 0.011 mm/year) (P < 0.001). This trend became significantly more prominent in classification 2, where the growth rate was 61.7% higher in the FZS group (0.215 ± 0.012 mm/year) than in the FZI group (0.133 ± 0.009 mm/year) (P < 0.001). The estimated GA effective radius growth rates in eight retinal zones fit a Gaussian function, and the modeling of GA expansion gave rise to various GA configurations comparable to clinical observations.
This study indicates that the GA progression rate varies significantly across different retinal locations. Our analysis may shed light on the natural history and underlying mechanism of GA progression.
确定地形位置对地图状萎缩(GA)进展速度的影响。
我们在五个文献数据库中进行了检索,截至 2019 年 5 月 3 日,评估了不同视网膜区域 GA 病变增长率的研究。我们进行了随机效应荟萃分析,以确定和比较两种不同分类方案定义的四个位置组中 GA 有效半径的增长率:(1)分类 1 中涉及(CPI)或未涉及(CPS)黄斑中心点,以及(2)分类 2 中涉及(FZI)或未涉及(FZS)的中央凹区。然后,我们估计了八个地形区域的 GA 增长率,并使用这些数据对 GA 扩展进行建模。
我们纳入了 11 项研究,涉及 3254 只眼睛。在使用分类 1 的研究中,CPS 组的有效半径增长率(0.203 ± 0.013mm/年)比 CPI 组(0.156 ± 0.011mm/年)高 30.1%(P < 0.001)。这种趋势在分类 2 中变得更加显著,FZS 组的增长率(0.215 ± 0.012mm/年)比 FZI 组(0.133 ± 0.009mm/年)高 61.7%(P < 0.001)。八个视网膜区域的 GA 有效半径增长率符合高斯函数,GA 扩展的建模产生了与临床观察相当的各种 GA 配置。
本研究表明,GA 的进展速度在不同的视网膜位置之间有显著差异。我们的分析可能揭示了 GA 进展的自然史和潜在机制。