• 文献检索
  • 文档翻译
  • 深度研究
  • 学术资讯
  • Suppr Zotero 插件Zotero 插件
  • 邀请有礼
  • 套餐&价格
  • 历史记录
应用&插件
Suppr Zotero 插件Zotero 插件浏览器插件Mac 客户端Windows 客户端微信小程序
定价
高级版会员购买积分包购买API积分包
服务
文献检索文档翻译深度研究API 文档MCP 服务
关于我们
关于 Suppr公司介绍联系我们用户协议隐私条款
关注我们

Suppr 超能文献

核心技术专利:CN118964589B侵权必究
粤ICP备2023148730 号-1Suppr @ 2026

文献检索

告别复杂PubMed语法,用中文像聊天一样搜索,搜遍4000万医学文献。AI智能推荐,让科研检索更轻松。

立即免费搜索

文件翻译

保留排版,准确专业,支持PDF/Word/PPT等文件格式,支持 12+语言互译。

免费翻译文档

深度研究

AI帮你快速写综述,25分钟生成高质量综述,智能提取关键信息,辅助科研写作。

立即免费体验

2020 年 1-2 月中国 COVID-19 疫情的生态流行病学评估。

Eco-epidemiological assessment of the COVID-19 epidemic in China, January-February 2020.

机构信息

Department of Epidemiology and Global Health, Umeå University, Umeå, Sweden.

Aberdeen Centre for Health Data Science (ACHDS), Institute of Applied Health Sciences, School of Medicine, Medical Sciences and Nutrition, University of Aberdeen, Aberdeen, Scotland.

出版信息

Glob Health Action. 2020 Dec 31;13(1):1760490. doi: 10.1080/16549716.2020.1760490.

DOI:10.1080/16549716.2020.1760490
PMID:32404043
原文链接:https://pmc.ncbi.nlm.nih.gov/articles/PMC7269037/
Abstract

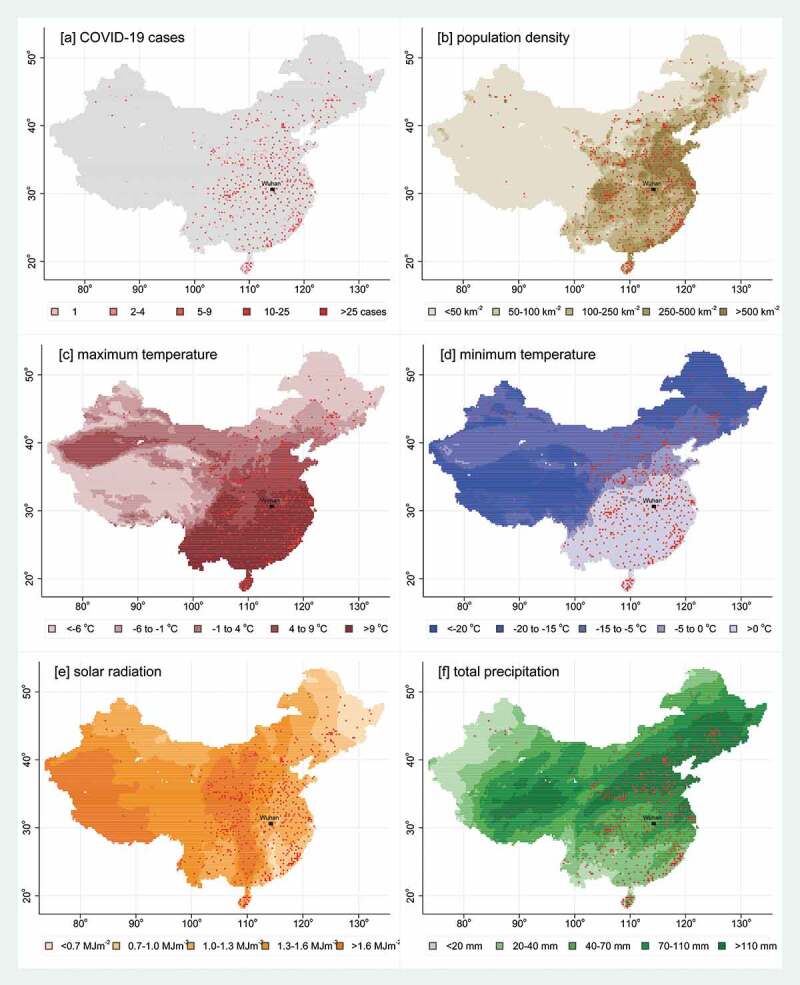
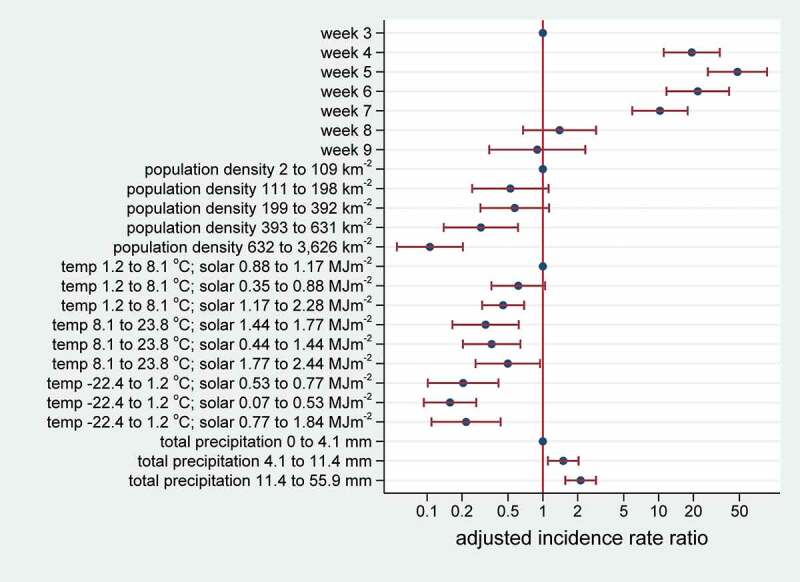
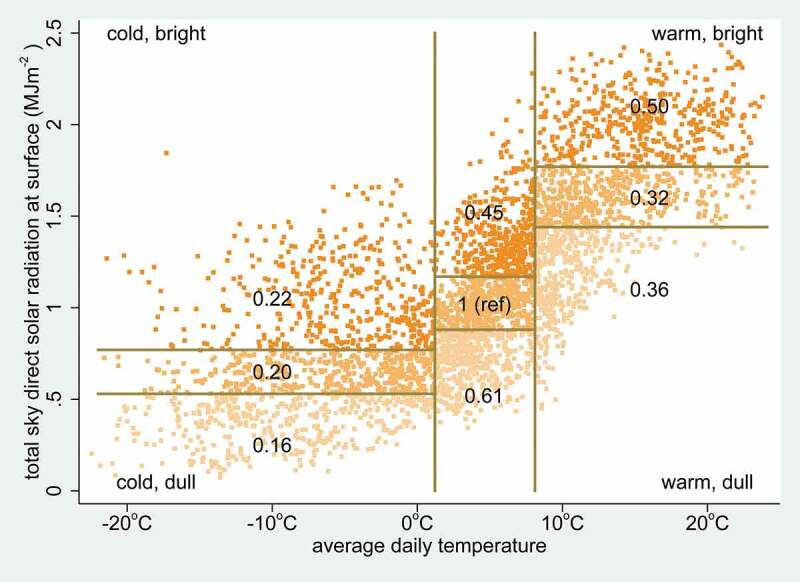
: The outbreak of COVID-19 in China in early 2020 provides a rich data source for exploring the ecological determinants of this new infection, which may be of relevance as the pandemic develops.: Assessing the spread of the COVID-19 across China, in relation to associations between cases and ecological factors including population density, temperature, solar radiation and precipitation.: Open-access COVID-19 case data include 18,069 geo-located cases in China during January and February 2020, which were mapped onto a 0.25° latitude/longitude grid together with population and weather data (temperature, solar radiation and precipitation). Of 15,539 grid cells, 559 (3.6%) contained at least one case, and these were used to construct a Poisson regression model of cell-weeks. Weather parameters were taken for the preceding week given the established 5-7 day incubation period for COVID-19. The dependent variable in the Poisson model was incident cases per cell-week and exposure was cell population, allowing for clustering of cells over weeks, to give incidence rate ratios.: The overall COVID-19 incidence rate in cells with confirmed cases was 0.12 per 1,000. There was a single confirmed case in 113/559 (20.2%) of cells, while two grid cells recorded over 1,000 confirmed cases. Weekly means of maximum daily temperature varied from -28.0°C to 30.1°C, minimum daily temperature from -42.4°C to 23.0°C, maximum solar radiation from 0.04 to 2.74 MJm and total precipitation from 0 to 72.6 mm. Adjusted incidence rate ratios suggested brighter, warmer and drier conditions were associated with lower incidence.: Though not demonstrating cause and effect, there were appreciable associations between weather and COVID-19 incidence during the epidemic in China. This does not mean the pandemic will go away with summer weather but demonstrates the importance of using weather conditions in understanding and forecasting the spread of COVID-19.

摘要

2020 年初中国新冠肺炎疫情的爆发为探索这种新感染的生态决定因素提供了丰富的数据来源,随着疫情的发展,这些因素可能具有相关性。评估新冠肺炎在中国的传播情况,与病例与人口密度、温度、太阳辐射和降水等生态因素之间的关联。公开获取的新冠肺炎病例数据包括 2020 年 1 月和 2 月期间中国的 18069 例地理位置确定的病例,这些病例与人口和气象数据(温度、太阳辐射和降水)一起被映射到 0.25°的纬度/经度网格上。在 15539 个网格单元中,有 559 个(3.6%)至少包含一个病例,这些病例被用于构建细胞周的泊松回归模型。考虑到新冠肺炎 5-7 天的潜伏期,在每周前一周采用气象参数。泊松模型中的因变量是每细胞周的发病例数,暴露因素是细胞人口,使细胞周的聚类能够进行,以给出发病率比。有确诊病例的细胞中,新冠肺炎的总发病率为每 1000 人 0.12 例。在 559 个(20.2%)有确诊病例的细胞中,有一个确诊病例,而有两个网格单元记录了超过 1000 个确诊病例。每周最高日平均温度从-28.0°C到 30.1°C不等,最低日平均温度从-42.4°C到 23.0°C不等,最高太阳辐射从 0.04 到 2.74 MJm,总降水量从 0 到 72.6mm。调整后的发病率比表明,天气晴朗、温暖和干燥的条件与较低的发病率有关。尽管没有证明因果关系,但在中国疫情期间,天气与新冠肺炎发病率之间存在明显的关联。这并不意味着随着夏季天气的到来,大流行就会结束,但这表明在了解和预测新冠肺炎的传播时,利用天气条件非常重要。

https://cdn.ncbi.nlm.nih.gov/pmc/blobs/3f16/7269037/c6ed2385994a/ZGHA_A_1760490_F0003_OC.jpg
https://cdn.ncbi.nlm.nih.gov/pmc/blobs/3f16/7269037/eba91fdbc7f8/ZGHA_A_1760490_F0001_OC.jpg
https://cdn.ncbi.nlm.nih.gov/pmc/blobs/3f16/7269037/e312eeaa1314/ZGHA_A_1760490_F0002_OC.jpg
https://cdn.ncbi.nlm.nih.gov/pmc/blobs/3f16/7269037/c6ed2385994a/ZGHA_A_1760490_F0003_OC.jpg
https://cdn.ncbi.nlm.nih.gov/pmc/blobs/3f16/7269037/eba91fdbc7f8/ZGHA_A_1760490_F0001_OC.jpg
https://cdn.ncbi.nlm.nih.gov/pmc/blobs/3f16/7269037/e312eeaa1314/ZGHA_A_1760490_F0002_OC.jpg
https://cdn.ncbi.nlm.nih.gov/pmc/blobs/3f16/7269037/c6ed2385994a/ZGHA_A_1760490_F0003_OC.jpg

相似文献

1
Eco-epidemiological assessment of the COVID-19 epidemic in China, January-February 2020.2020 年 1-2 月中国 COVID-19 疫情的生态流行病学评估。
Glob Health Action. 2020 Dec 31;13(1):1760490. doi: 10.1080/16549716.2020.1760490.
2
The correlation between the spread of COVID-19 infections and weather variables in 30 Chinese provinces and the impact of Chinese government mitigation plans.中国 30 个省份 COVID-19 感染传播与气象变量的相关性及中国政府缓解计划的影响。
Eur Rev Med Pharmacol Sci. 2020 Apr;24(8):4565-4571. doi: 10.26355/eurrev_202004_21042.
3
Distribution of the SARS-CoV-2 Pandemic and Its Monthly Forecast Based on Seasonal Climate Patterns.基于季节性气候模式的 SARS-CoV-2 大流行分布及其月度预测。
Int J Environ Res Public Health. 2020 May 17;17(10):3493. doi: 10.3390/ijerph17103493.
4
Association of Social Distancing, Population Density, and Temperature With the Instantaneous Reproduction Number of SARS-CoV-2 in Counties Across the United States.社交距离、人口密度和温度与美国各县 SARS-CoV-2 瞬时繁殖数的关系。
JAMA Netw Open. 2020 Jul 1;3(7):e2016099. doi: 10.1001/jamanetworkopen.2020.16099.
5
Association of Public Health Interventions With the Epidemiology of the COVID-19 Outbreak in Wuhan, China.公共卫生干预措施与中国武汉 COVID-19 疫情流行病学的关联。
JAMA. 2020 May 19;323(19):1915-1923. doi: 10.1001/jama.2020.6130.
6
Estimated Demand for US Hospital Inpatient and Intensive Care Unit Beds for Patients With COVID-19 Based on Comparisons With Wuhan and Guangzhou, China.基于与中国武汉和广州的比较,估计美国因 COVID-19 住院和重症监护病房床位的需求。
JAMA Netw Open. 2020 May 1;3(5):e208297. doi: 10.1001/jamanetworkopen.2020.8297.
7
Association between ambient temperature and COVID-19 infection in 122 cities from China.中国 122 个城市的环境温度与 COVID-19 感染的关联。
Sci Total Environ. 2020 Jul 1;724:138201. doi: 10.1016/j.scitotenv.2020.138201. Epub 2020 Mar 30.
8
Relationship between COVID-19 and weather: Case study in a tropical country.新型冠状病毒肺炎与天气的关系:热带国家的案例研究。
Int J Hyg Environ Health. 2020 Aug;229:113587. doi: 10.1016/j.ijheh.2020.113587. Epub 2020 Jun 19.
9
Data-based analysis, modelling and forecasting of the COVID-19 outbreak.基于数据的 COVID-19 疫情分析、建模和预测。
PLoS One. 2020 Mar 31;15(3):e0230405. doi: 10.1371/journal.pone.0230405. eCollection 2020.
10
Impact of weather conditions on incidence and mortality of COVID-19 pandemic in Africa.天气条件对非洲 COVID-19 大流行发病率和死亡率的影响。
Eur Rev Med Pharmacol Sci. 2020 Sep;24(18):9753-9759. doi: 10.26355/eurrev_202009_23069.

引用本文的文献

1
Early pandemic associations of latitude, sunshine duration, and vitamin D status with COVID-19 incidence and fatalities: A global analysis of 187 Countries.大流行早期纬度、日照时长和维生素D状况与新冠肺炎发病率及死亡率的关联:对187个国家的全球分析
PLOS Glob Public Health. 2025 Jul 28;5(7):e0004074. doi: 10.1371/journal.pgph.0004074. eCollection 2025.
2
Trends of the COVID-19 dynamics in 2022 and 2023 vs. the population age, testing and vaccination levels.2022年和2023年新冠疫情动态与人口年龄、检测及疫苗接种水平的趋势对比。
Front Big Data. 2024 Jan 10;6:1355080. doi: 10.3389/fdata.2023.1355080. eCollection 2023.
3

本文引用的文献

1
Temperature, Humidity, and Latitude Analysis to Estimate Potential Spread and Seasonality of Coronavirus Disease 2019 (COVID-19).温度、湿度和纬度分析估计 2019 年冠状病毒病(COVID-19)的潜在传播和季节性。
JAMA Netw Open. 2020 Jun 1;3(6):e2011834. doi: 10.1001/jamanetworkopen.2020.11834.
2
COVID-19 transmission in Mainland China is associated with temperature and humidity: A time-series analysis.中国大陆 COVID-19 的传播与温度和湿度有关:一项时间序列分析。
Sci Total Environ. 2020 Aug 1;728:138778. doi: 10.1016/j.scitotenv.2020.138778. Epub 2020 Apr 19.
3
Data-based analysis, modelling and forecasting of the COVID-19 outbreak.
Exploring the Spatial Relative Risk of COVID-19 in Berlin-Neukölln.
探索柏林-诺伊科伦的 COVID-19 空间相对风险。
Int J Environ Res Public Health. 2023 May 16;20(10):5830. doi: 10.3390/ijerph20105830.
4
Prediction of the COVID-19 transmission: a case study of Pakistan.预测 COVID-19 传播:以巴基斯坦为例的研究。
Epidemiol Infect. 2023 May 19;151:e89. doi: 10.1017/S0950268823000730.
5
Spatial relationship between COVID-19 and previous infectious disease outbreaks: Evidence from South Korea.新型冠状病毒肺炎(COVID-19)与既往传染病暴发之间的空间关系:来自韩国的证据。
Heliyon. 2023 May;9(5):e15635. doi: 10.1016/j.heliyon.2023.e15635. Epub 2023 Apr 21.
6
The Association of Opioid Use Disorder and COVID-19, a Longitudinal Study.阿片类物质使用障碍与2019冠状病毒病的关联:一项纵向研究
Int J Prev Med. 2022 Dec 26;13:157. doi: 10.4103/ijpvm.ijpvm_68_22. eCollection 2022.
7
A life in death: reflections of Peter.生死之间的生活:彼得的反思。
Glob Health Action. 2021 Oct 26;14(sup1):2056377. doi: 10.1080/16549716.2021.2056377.
8
Effects of environmental parameters and their interactions on the spreading of SARS-CoV-2 in North Italy under different social restrictions. A new approach based on multivariate analysis.环境参数及其相互作用对不同社会限制下意大利北部 SARS-CoV-2 传播的影响。一种基于多元分析的新方法。
Environ Res. 2022 Jul;210:112921. doi: 10.1016/j.envres.2022.112921. Epub 2022 Feb 10.
9
SARS-CoV-2: lessons from both the history of medicine and from the biological behavior of other well-known viruses.SARS-CoV-2:从医学史和其他知名病毒的生物学行为中吸取的教训。
Future Microbiol. 2021 Sep;16(14):1105-1133. doi: 10.2217/fmb-2021-0064. Epub 2021 Sep 1.
10
"Distance-Driven" Versus "Density-Driven": Understanding the Role of "Source-Case" Distance and Gathering Places in the Localized Spatial Clustering of COVID-19-A Case Study of the Xinfadi Market, Beijing (China).“距离驱动”与“密度驱动”:理解“源病例”距离和聚集场所在北京新发地市场(中国)新冠疫情局部空间聚集性中的作用——一项案例研究
Geohealth. 2021 Aug 1;5(8):e2021GH000458. doi: 10.1029/2021GH000458. eCollection 2021 Aug.
基于数据的 COVID-19 疫情分析、建模和预测。
PLoS One. 2020 Mar 31;15(3):e0230405. doi: 10.1371/journal.pone.0230405. eCollection 2020.
4
The effect of control strategies to reduce social mixing on outcomes of the COVID-19 epidemic in Wuhan, China: a modelling study.控制策略对减少社交接触以控制中国武汉 COVID-19 疫情的效果:建模研究。
Lancet Public Health. 2020 May;5(5):e261-e270. doi: 10.1016/S2468-2667(20)30073-6. Epub 2020 Mar 25.
5
The Incubation Period of Coronavirus Disease 2019 (COVID-19) From Publicly Reported Confirmed Cases: Estimation and Application.新型冠状病毒肺炎(COVID-19)的潜伏期来自公开报告的确诊病例:估计和应用。
Ann Intern Med. 2020 May 5;172(9):577-582. doi: 10.7326/M20-0504. Epub 2020 Mar 10.
6
Open access epidemiological data from the COVID-19 outbreak.来自新冠疫情的开放获取流行病学数据。
Lancet Infect Dis. 2020 May;20(5):534. doi: 10.1016/S1473-3099(20)30119-5. Epub 2020 Feb 19.
7
Spatiotemporal Clustering of Middle East Respiratory Syndrome Coronavirus (MERS-CoV) Incidence in Saudi Arabia, 2012-2019.2012-2019 年沙特阿拉伯中东呼吸综合征冠状病毒(MERS-CoV)发病率的时空聚集性。
Int J Environ Res Public Health. 2019 Jul 15;16(14):2520. doi: 10.3390/ijerph16142520.
8
Low Temperature and Low UV Indexes Correlated with Peaks of Influenza Virus Activity in Northern Europe during 2010⁻2018.2010-2018 年期间,北欧流感病毒活动高峰期与低温和低紫外线指数相关。
Viruses. 2019 Mar 1;11(3):207. doi: 10.3390/v11030207.
9
Human Coronavirus in Hospitalized Children With Respiratory Tract Infections: A 9-Year Population-Based Study From Norway.人冠状病毒在呼吸道感染住院患儿中的研究:来自挪威的一项 9 年的基于人群的研究。
J Infect Dis. 2019 Apr 8;219(8):1198-1206. doi: 10.1093/infdis/jiy646.
10
The calendar of epidemics: Seasonal cycles of infectious diseases.传染病年历:传染病的季节性周期
PLoS Pathog. 2018 Nov 8;14(11):e1007327. doi: 10.1371/journal.ppat.1007327. eCollection 2018 Nov.