• 文献检索
  • 文档翻译
  • 深度研究
  • 学术资讯
  • Suppr Zotero 插件Zotero 插件
  • 邀请有礼
  • 套餐&价格
  • 历史记录
应用&插件
Suppr Zotero 插件Zotero 插件浏览器插件Mac 客户端Windows 客户端微信小程序
定价
高级版会员购买积分包购买API积分包
服务
文献检索文档翻译深度研究API 文档MCP 服务
关于我们
关于 Suppr公司介绍联系我们用户协议隐私条款
关注我们

Suppr 超能文献

核心技术专利:CN118964589B侵权必究
粤ICP备2023148730 号-1Suppr @ 2026

文献检索

告别复杂PubMed语法,用中文像聊天一样搜索,搜遍4000万医学文献。AI智能推荐,让科研检索更轻松。

立即免费搜索

文件翻译

保留排版,准确专业,支持PDF/Word/PPT等文件格式,支持 12+语言互译。

免费翻译文档

深度研究

AI帮你快速写综述,25分钟生成高质量综述,智能提取关键信息,辅助科研写作。

立即免费体验

基于贝叶斯定理的新型冠状病毒(COVID-19)病死率计算:一项观察性研究。

The computation of case fatality rate for novel coronavirus (COVID-19) based on Bayes theorem: An observational study.

作者信息

Chang Chi-Sheng, Yeh Yu-Tsen, Chien Tsair-Wei, Lin Jui-Chung John, Cheng Bor-Wen, Kuo Shu-Chun

机构信息

Center for Quality Management, Chi Mei Medical Center, Liouying.

Department of Industrial Engineering and Management, National Yunlin University of Science and Technology, Yunlin.

出版信息

Medicine (Baltimore). 2020 May 22;99(21):e19925. doi: 10.1097/MD.0000000000019925.

DOI:10.1097/MD.0000000000019925
PMID:32481256
原文链接:https://pmc.ncbi.nlm.nih.gov/articles/PMC7249957/
Abstract

BACKGROUND

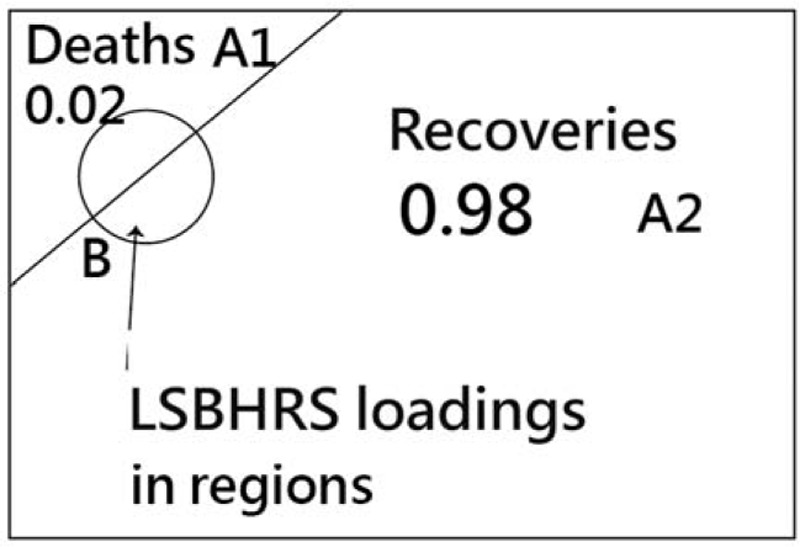
When a new disease such starts to spread, the commonly asked questions are how deadly is it? and how many people are likely to die of this outbreak? The World Health Organization (WHO) announced in a press conference on January 29, 2020 that the death rate of COVID-19 was 2% on the case fatality rate (CFR). It was underestimated assuming no lag days from symptom onset to deaths while many CFR formulas have been proposed, the estimation on Bays theorem is worthy of interpretation. Hence, it is hypothesized that the over-loaded burdens of treating patients and capacities to contain the outbreak (LSBHRS) may increase the CFR.

METHODS

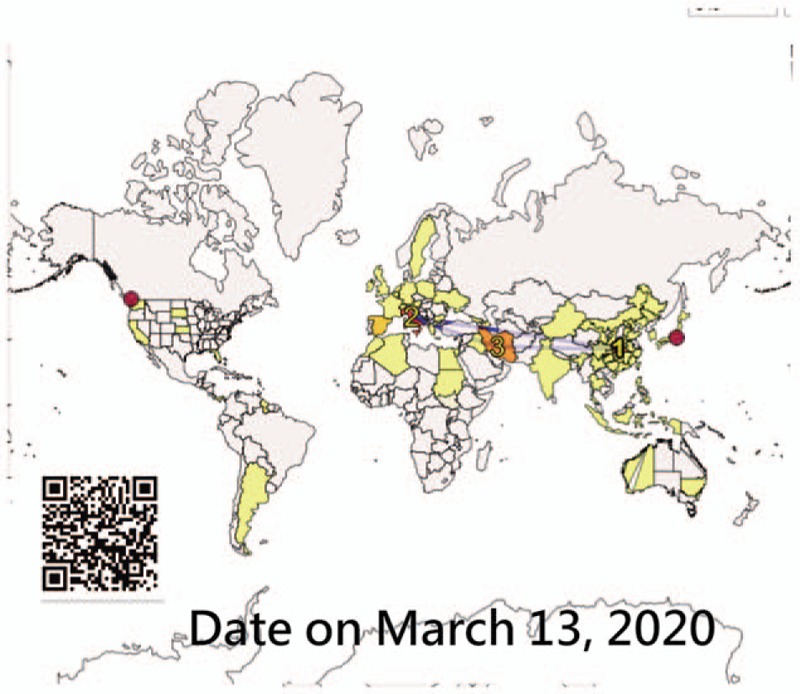
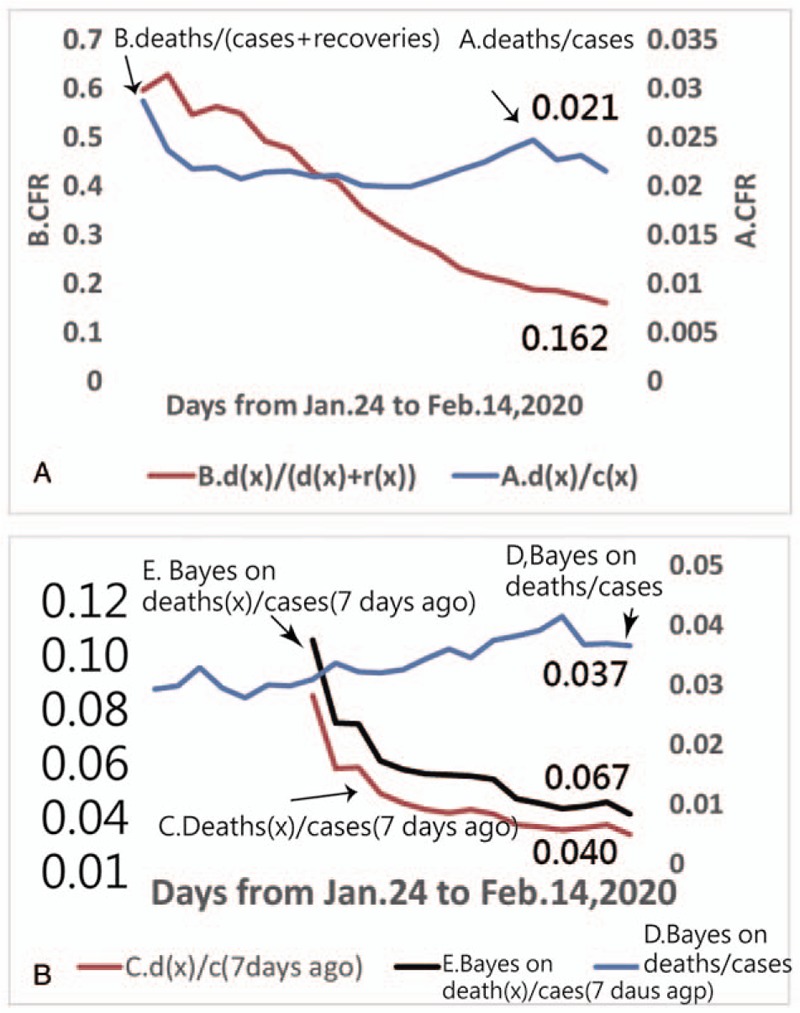
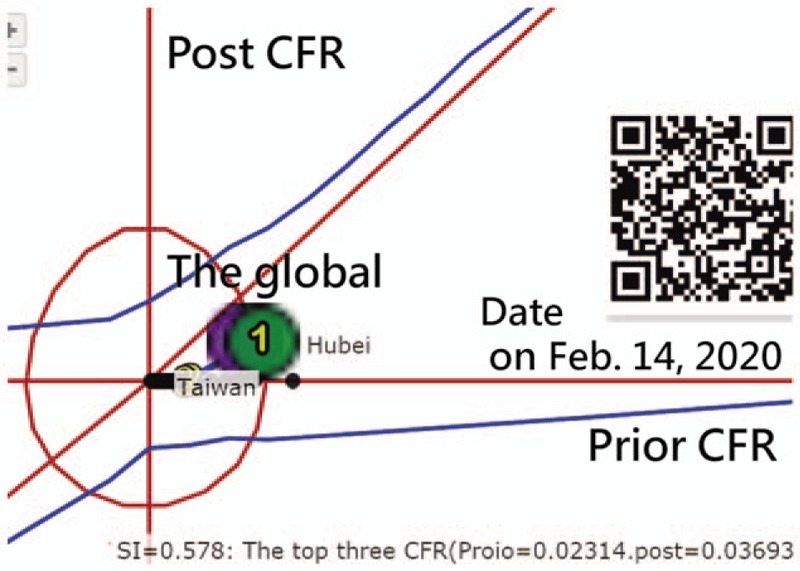
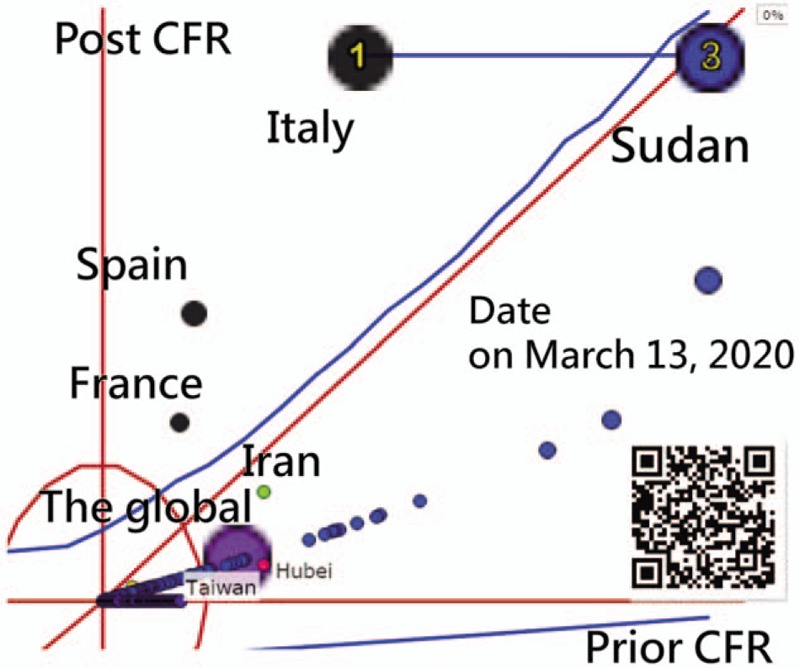
We downloaded COVID-19 outbreak numbers from January 21 to February 14, 2020, in countries/regions on a daily basis from Github that contains information on confirmed cases in >30 Chinese locations and other countries/regions. The pros and cons were compared among the 5 formula of CFR, including [A] deaths/confirmed; [B] deaths/(deaths + recovered); [C] deaths/(cases x days ago); [D] Bayes estimation based on [A] and the outbreak (LSBHRS) in each country/region; and [E] Bayes estimation based on [C] deaths/(cases x days ago). The coefficients of variance (CV = the ratio of the standard deviation to the mean) were applied to measure the relative variability for each CFR. A dashboard was developed for daily display of the CFR across each region.

RESULTS

The Bayes based on (A)[D] has the lowest CV (=0.10) followed by the deaths/confirmed (=0.11) [A], deaths/(deaths + recoveries) (=0.42) [B], Bayes based on (C) (=0.49) [E], and deaths/(cases x days ago) (=0.59) [C]. All final CFRs will be equal using the formula (from, A to E). A dashboard was developed for the daily reporting of the CFR. The CFR (3.7%) greater than the prior CFR of 2.2% was evident in LSBHRS, increasing the CFR. A dashboard was created to present the CFRs on COVID-19.

CONCLUSION

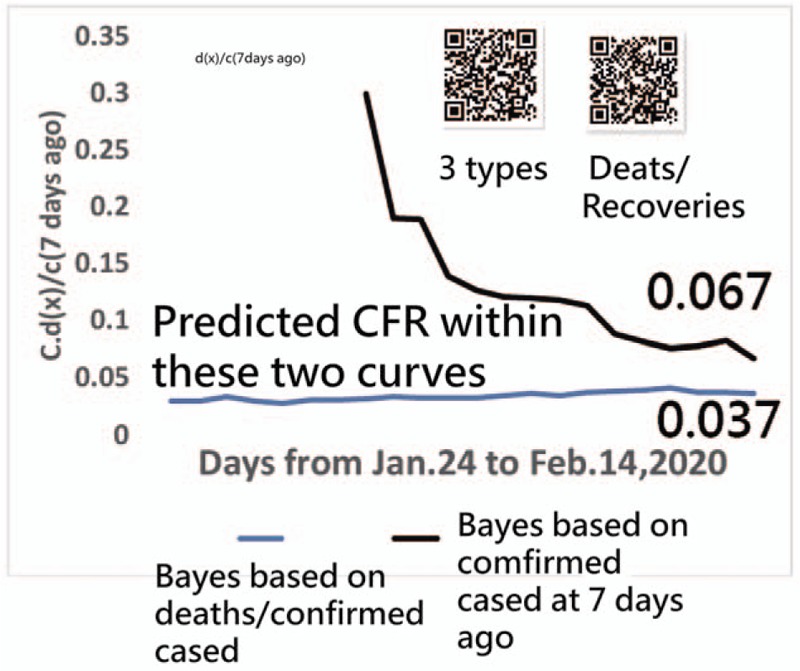
We suggest examining both trends of the Bayes based on both deaths/(cases 7 days ago) and deaths/confirmed cases as a reference to the final CFR. An app developed for displaying the provisional CFR with the 2 CFR trends can improve the underestimated CFR reported by WHO and media.

摘要

背景

当一种新疾病开始传播时,常见的问题是它有多致命?以及这次疫情可能导致多少人死亡?世界卫生组织(WHO)在2020年1月29日的新闻发布会上宣布,新冠病毒病的病死率(CFR)为2%。在假设从症状出现到死亡没有延迟天数的情况下,这一数据被低估了。虽然已经提出了许多CFR公式,但基于贝叶斯定理的估计值得解读。因此,假设治疗患者的过重负担和控制疫情的能力(LSBHRS)可能会增加CFR。

方法

我们每天从Github上下载2020年1月21日至2月14日各国/地区的新冠病毒病疫情数据,该数据包含中国30多个地区及其他国家/地区的确诊病例信息。比较了CFR的5种公式的优缺点,包括[A]死亡数/确诊数;[B]死亡数/(死亡数+康复数);[C]死亡数/(病例数×数天前);[D]基于[A]和每个国家/地区疫情(LSBHRS)的贝叶斯估计;以及[E]基于[C]死亡数/(病例数×数天前)的贝叶斯估计。应用方差系数(CV=标准差与均值之比)来衡量每个CFR的相对变异性。开发了一个仪表板用于每日展示各地区的CFR。

结果

基于(A)[D]的贝叶斯估计的CV最低(=0.10),其次是死亡数/确诊数(=0.11)[A]、死亡数/(死亡数+康复数)(=0.42)[B]、基于(C)的贝叶斯估计(=0.49)[E]以及死亡数/(病例数×数天前)(=0.59)[C]。使用公式(从A到E)所有最终的CFR将是相等的。开发了一个仪表板用于每日报告CFR。在LSBHRS中,CFR(3.7%)高于之前的2.2%,这一情况很明显,增加了CFR。创建了一个仪表板来展示新冠病毒病的CFR。

结论

我们建议同时考察基于死亡数/(7天前病例数)和死亡数/确诊病例数的贝叶斯估计趋势,作为最终CFR的参考。开发一个用于显示临时CFR及这两种CFR趋势的应用程序,可以改善WHO和媒体报道中被低估的CFR。

https://cdn.ncbi.nlm.nih.gov/pmc/blobs/ef2b/7249957/0e0c3e8f9583/medi-99-e19925-g015.jpg
https://cdn.ncbi.nlm.nih.gov/pmc/blobs/ef2b/7249957/1673e841b665/medi-99-e19925-g003.jpg
https://cdn.ncbi.nlm.nih.gov/pmc/blobs/ef2b/7249957/414c06502ba7/medi-99-e19925-g010.jpg
https://cdn.ncbi.nlm.nih.gov/pmc/blobs/ef2b/7249957/4b56eeb61aa2/medi-99-e19925-g011.jpg
https://cdn.ncbi.nlm.nih.gov/pmc/blobs/ef2b/7249957/e89de8761e9d/medi-99-e19925-g013.jpg
https://cdn.ncbi.nlm.nih.gov/pmc/blobs/ef2b/7249957/40a340b95977/medi-99-e19925-g014.jpg
https://cdn.ncbi.nlm.nih.gov/pmc/blobs/ef2b/7249957/0e0c3e8f9583/medi-99-e19925-g015.jpg

相似文献

1
The computation of case fatality rate for novel coronavirus (COVID-19) based on Bayes theorem: An observational study.基于贝叶斯定理的新型冠状病毒(COVID-19)病死率计算:一项观察性研究。
Medicine (Baltimore). 2020 May 22;99(21):e19925. doi: 10.1097/MD.0000000000019925.
2
Geographic risk assessment of COVID-19 transmission using recent data: An observational study.利用近期数据进行新冠病毒传播的地理风险评估:一项观察性研究。
Medicine (Baltimore). 2020 Jun 12;99(24):e20774. doi: 10.1097/MD.0000000000020774.
3
Estimating the instant case fatality rate of COVID-19 in China.估算中国 COVID-19 的即时病死率。
Int J Infect Dis. 2020 Aug;97:1-6. doi: 10.1016/j.ijid.2020.04.055. Epub 2020 Apr 24.
4
Temporal estimates of case-fatality rate for COVID-19 outbreaks in Canada and the United States.加拿大和美国 COVID-19 疫情的病死率时间估算。
CMAJ. 2020 Jun 22;192(25):E666-E670. doi: 10.1503/cmaj.200711. Epub 2020 May 22.
5
Monitoring trends and differences in COVID-19 case-fatality rates using decomposition methods: Contributions of age structure and age-specific fatality.使用分解方法监测 COVID-19 病死率的趋势和差异:年龄结构和特定年龄病死率的贡献。
PLoS One. 2020 Sep 10;15(9):e0238904. doi: 10.1371/journal.pone.0238904. eCollection 2020.
6
Coronavirus Disease 2019 (COVID-19): A Modeling Study of Factors Driving Variation in Case Fatality Rate by Country.2019 年冠状病毒病(COVID-19):按国家划分的病死率变化驱动因素的建模研究。
Int J Environ Res Public Health. 2020 Nov 5;17(21):8189. doi: 10.3390/ijerph17218189.
7
The confounded crude case-fatality rates (CFR) for COVID-19 hide more than they reveal-a comparison of age-specific and age-adjusted CFRs between seven countries.新冠病毒粗病死率(CFR)令人困惑,其隐藏的信息多于揭示的信息——七个国家的年龄特异性和年龄调整后 CFR 比较。
PLoS One. 2020 Oct 21;15(10):e0241031. doi: 10.1371/journal.pone.0241031. eCollection 2020.
8
Real-time naive case fatality rates can reflect timeliness of case confirmation during pandemics.实时原始病死率可以反映大流行期间病例确诊的及时性。
J Infect Public Health. 2020 Sep;13(9):1363-1366. doi: 10.1016/j.jiph.2020.07.012. Epub 2020 Aug 11.
9
Using the Kano model to associate the number of confirmed cases of COVID-19 in a population of 100,000 with case fatality rates: An observational study.利用卡诺模型将 10 万人的 COVID-19 确诊病例数与病死率进行关联:一项观察性研究。
Medicine (Baltimore). 2022 Sep 16;101(37):e30648. doi: 10.1097/MD.0000000000030648.
10
Preliminary Estimate of Excess Mortality During the COVID-19 Outbreak - New York City, March 11-May 2, 2020.2020 年 3 月 11 日至 5 月 2 日期间 COVID-19 爆发期间超额死亡的初步估计-纽约市。
MMWR Morb Mortal Wkly Rep. 2020 May 15;69(19):603-605. doi: 10.15585/mmwr.mm6919e5.

引用本文的文献

1
Urban environmental and population factors as determinants of COVID-19 severity: A spatially-resolved probabilistic modeling approach.城市环境和人口因素作为新冠病毒疾病严重程度的决定因素:一种空间解析概率建模方法。
PLOS Digit Health. 2025 Jul 18;4(7):e0000921. doi: 10.1371/journal.pdig.0000921. eCollection 2025 Jul.
2
The 95% control lines on both confirmed cases and days of infection with COVID-19 were applied to compare the impact on public health between 2020 and 2021 using the hT-index.对 2020 年和 2021 年的新冠病毒感染确诊病例和感染天数的 95%置信区间控制线进行了对比,使用 hT 指数来评估对公共卫生的影响。
Medicine (Baltimore). 2023 May 19;102(20):e33570. doi: 10.1097/MD.0000000000033570.
3
Characteristics and specifications of dashboards developed for the COVID-19 pandemic: a scoping review.
为应对新冠疫情而开发的仪表盘的特征与规范:一项范围综述
Z Gesundh Wiss. 2023 Feb 2:1-22. doi: 10.1007/s10389-023-01838-z.
4
The use of the time-to-event index (Tevent) to compare the negative impact of COVID-19 on public health among continents/regions in 2020 and 2021: An observational study.使用事件时间指数(Tevent)比较 2020 年和 2021 年各大陆/地区 COVID-19 对公共卫生的负面影响:一项观察性研究。
Medicine (Baltimore). 2022 Dec 9;101(49):e30249. doi: 10.1097/MD.0000000000030249.
5
COVID-19 Vaccination Knowledge, Perception, and Reason for Adherence and nonadherence Among Nursing Students in Egypt.埃及护理专业学生对COVID-19疫苗接种的知识、认知以及接种和未接种的原因
SAGE Open Nurs. 2022 Nov 27;8:23779608221141234. doi: 10.1177/23779608221141234. eCollection 2022 Jan-Dec.
6
Comparison of prediction accuracies between two mathematical models for the assessment of COVID-19 damage at the early stage and throughout 2020.比较两种数学模型在评估 COVID-19 早期和 2020 年全年损害方面的预测准确性。
Medicine (Baltimore). 2022 Aug 12;101(32):e29718. doi: 10.1097/MD.0000000000029718.
7
Pandemetrics: systematically assessing, monitoring, and controlling the evolution of a pandemic.疫情计量学:系统评估、监测和控制大流行病的演变。
Qual Quant. 2023;57(2):1701-1723. doi: 10.1007/s11135-022-01424-7. Epub 2022 Jun 8.
8
Vaccination associated with gross domestic product and fewer deaths in countries and regions: A verification study.接种疫苗与国内生产总值和国家及地区死亡人数减少相关:验证研究。
Medicine (Baltimore). 2022 Jan 28;101(4):e28619. doi: 10.1097/MD.0000000000028619.
9
An artificial neural network model to predict the mortality of COVID-19 patients using routine blood samples at the time of hospital admission: Development and validation study.一种使用入院时常规血液样本预测 COVID-19 患者死亡率的人工神经网络模型:开发和验证研究。
Medicine (Baltimore). 2021 Jul 16;100(28):e26532. doi: 10.1097/MD.0000000000026532.
10
Using the absolute advantage coefficient (AAC) to measure the strength of damage hit by COVID-19 in India on a growth-share matrix.利用绝对优势系数(AAC)在增长-份额矩阵上衡量新冠疫情对印度造成的损害程度。
Eur J Med Res. 2021 Jun 24;26(1):61. doi: 10.1186/s40001-021-00528-4.