Departamento de Zoología, Instituto de Biología, Universidad Nacional Autónoma de México, Ciudad de México, México.
Comisión Nacional para el Conocimiento y Uso de la Biodiversidad (Conabio), Ciudad de México, México.
PLoS One. 2020 Jul 16;15(7):e0209808. doi: 10.1371/journal.pone.0209808. eCollection 2020.
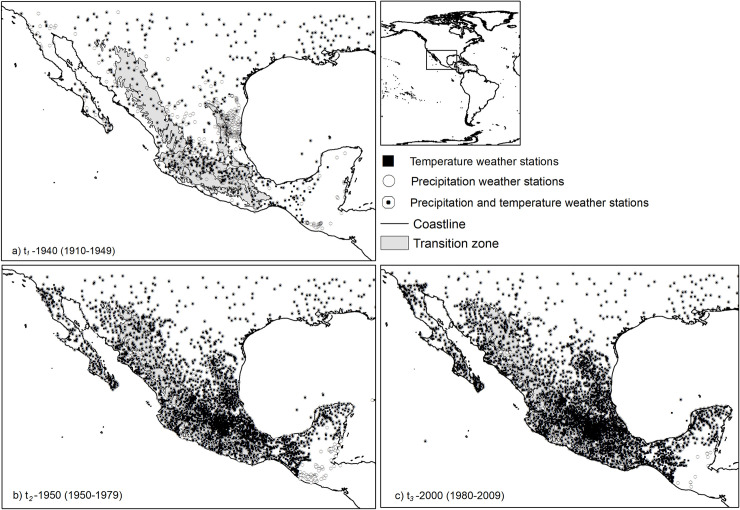
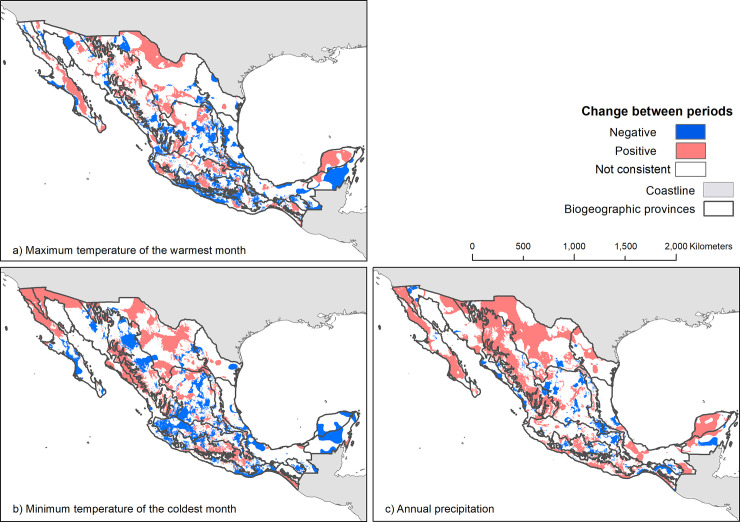
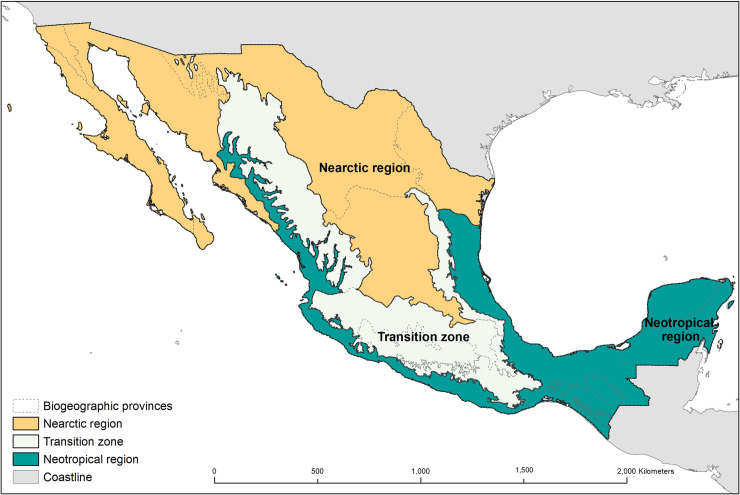
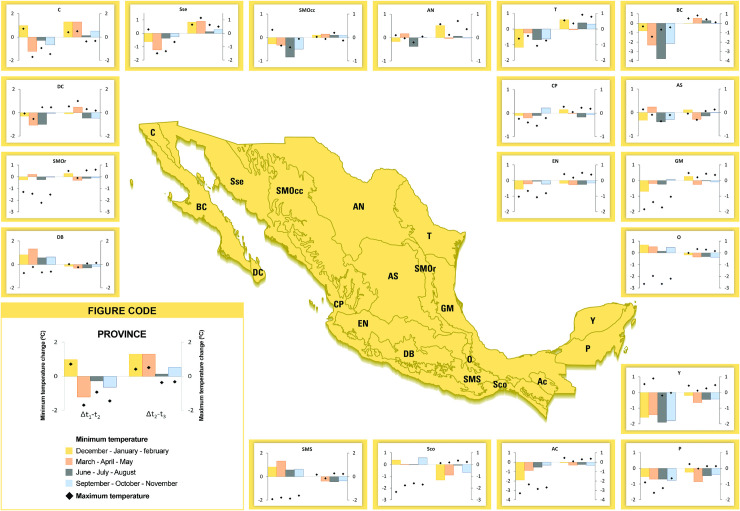
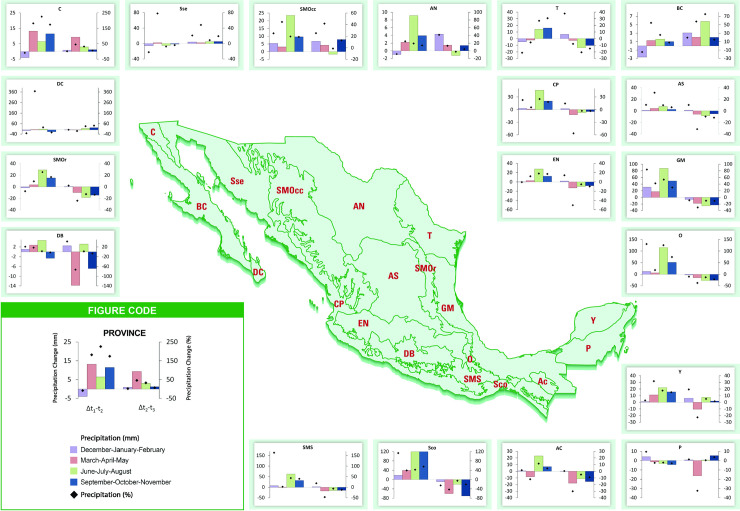
Spatial assessments of historical climate change provide information that can be used by scientists to analyze climate variation over time and evaluate, for example, its effects on biodiversity, in order to focus their research and conservation efforts. Despite the fact that there are global climatic databases available at high spatial resolution, they represent a short temporal window that impedes evaluating historical changes of climate and their impacts on biodiversity. To fill this gap, we developed climate gridded surfaces for Mexico for three periods that cover most of the 20th and early 21st centuries: t1-1940 (1910-1949), t2-1970 (1950-1979) and t3-2000 (1980-2009), and used these interpolated surfaces to describe how climate has changed over time, both countrywide and in its 19 biogeographic provinces. Results from our characterization of climate change indicate that the mean annual temperature has increased by nearly 0.2°C on average across the whole country from t2-1970 to t3-2000. However, changes have not been spatially uniform: Nearctic provinces in the north have suffered higher temperature increases than southern tropical regions. Central and southern provinces cooled at the beginning of the 20th century but warmed consistently since the 1970s. Precipitation increased between t1-1940 and t2-1970 across the country, more notably in the northern provinces, and it decreased between t2-1970 and t3-2000 in most of the country. Results on the historical climate conditions in Mexico may be useful for climate change analyses for both environmental and social sciences. Nonetheless, our climatology was based on information from climate stations for which 9.4-36.2% presented inhomogeneities over time probably owing to non-climatic factors, and climate station density changed over time. Therefore, the estimated changes observed in our analysis need to be interpreted cautiously.
空间评估历史气候变化提供了信息,科学家可以利用这些信息分析随时间推移的气候变化,并评估其对生物多样性的影响,以便集中研究和保护工作。尽管存在具有高空间分辨率的全球气候数据库,但它们仅代表一个短暂的时间窗口,这阻碍了对历史气候变化及其对生物多样性影响的评估。为了填补这一空白,我们针对墨西哥开发了三个时期的气候网格化表面,这些表面涵盖了 20 世纪和 21 世纪早期的大部分时间:t1-1940(1910-1949 年)、t2-1970(1950-1979 年)和 t3-2000(1980-2009 年),并使用这些插值表面来描述气候随时间的变化情况,包括全国范围内和其 19 个生物地理省的变化情况。我们对气候变化特征的描述表明,从 t2-1970 年到 t3-2000 年,整个国家的年平均气温平均升高了近 0.2°C。然而,变化并非空间均匀的:北方的近北极省比南部热带地区的温度升高更高。中部和南部省份在 20 世纪初变冷,但自 20 世纪 70 年代以来一直变暖。全国范围内,从 t1-1940 年到 t2-1970 年降水增加,北部省份更为显著,而从 t2-1970 年到 t3-2000 年,大部分地区的降水减少。墨西哥历史气候条件的结果可能对环境和社会科学的气候变化分析有用。然而,我们的气候学是基于气候变化站的信息,这些信息在时间上存在 9.4-36.2%的不均匀性,可能是由于非气候因素造成的,而且气候变化站的密度随时间发生了变化。因此,我们分析中观察到的估计变化需要谨慎解释。