• 文献检索
  • 文档翻译
  • 深度研究
  • 学术资讯
  • Suppr Zotero 插件Zotero 插件
  • 邀请有礼
  • 套餐&价格
  • 历史记录
应用&插件
Suppr Zotero 插件Zotero 插件浏览器插件Mac 客户端Windows 客户端微信小程序
定价
高级版会员购买积分包购买API积分包
服务
文献检索文档翻译深度研究API 文档MCP 服务
关于我们
关于 Suppr公司介绍联系我们用户协议隐私条款
关注我们

Suppr 超能文献

核心技术专利:CN118964589B侵权必究
粤ICP备2023148730 号-1Suppr @ 2026

文献检索

告别复杂PubMed语法,用中文像聊天一样搜索,搜遍4000万医学文献。AI智能推荐,让科研检索更轻松。

立即免费搜索

文件翻译

保留排版,准确专业,支持PDF/Word/PPT等文件格式,支持 12+语言互译。

免费翻译文档

深度研究

AI帮你快速写综述,25分钟生成高质量综述,智能提取关键信息,辅助科研写作。

立即免费体验

基于拓扑数据分析的多测量分类方法。

A topological data analysis based classification method for multiple measurements.

机构信息

University of Aberdeen, Aberdeen, UK.

KTH-The Royal Institute of Technology, Stockholm, Sweden.

出版信息

BMC Bioinformatics. 2020 Jul 29;21(1):336. doi: 10.1186/s12859-020-03659-3.

DOI:10.1186/s12859-020-03659-3
PMID:32727348
原文链接:https://pmc.ncbi.nlm.nih.gov/articles/PMC7392670/
Abstract

BACKGROUND

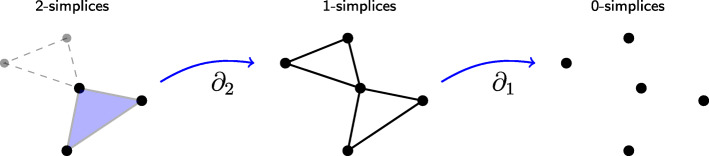
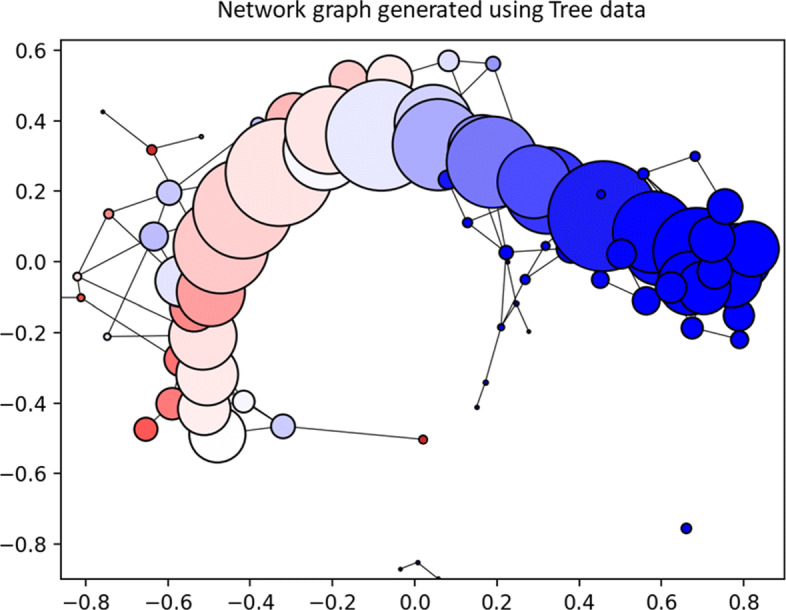
Machine learning models for repeated measurements are limited. Using topological data analysis (TDA), we present a classifier for repeated measurements which samples from the data space and builds a network graph based on the data topology. A machine learning model with cross-validation is then applied for classification. When test this on three case studies, accuracy exceeds an alternative support vector machine (SVM) voting model in most situations tested, with additional benefits such as reporting data subsets with high purity along with feature values.

RESULTS

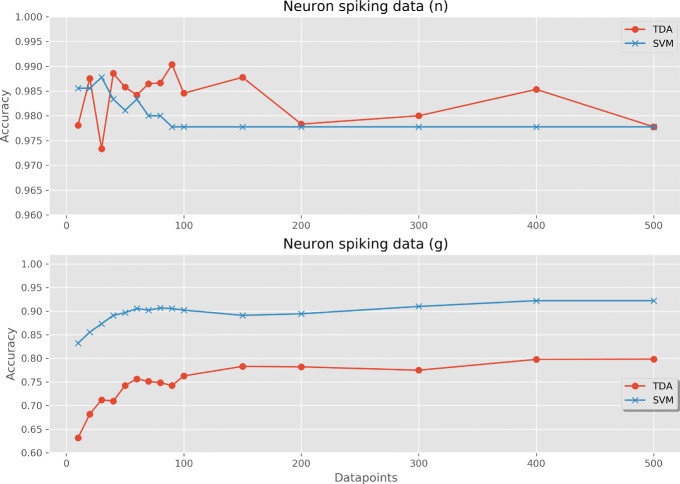
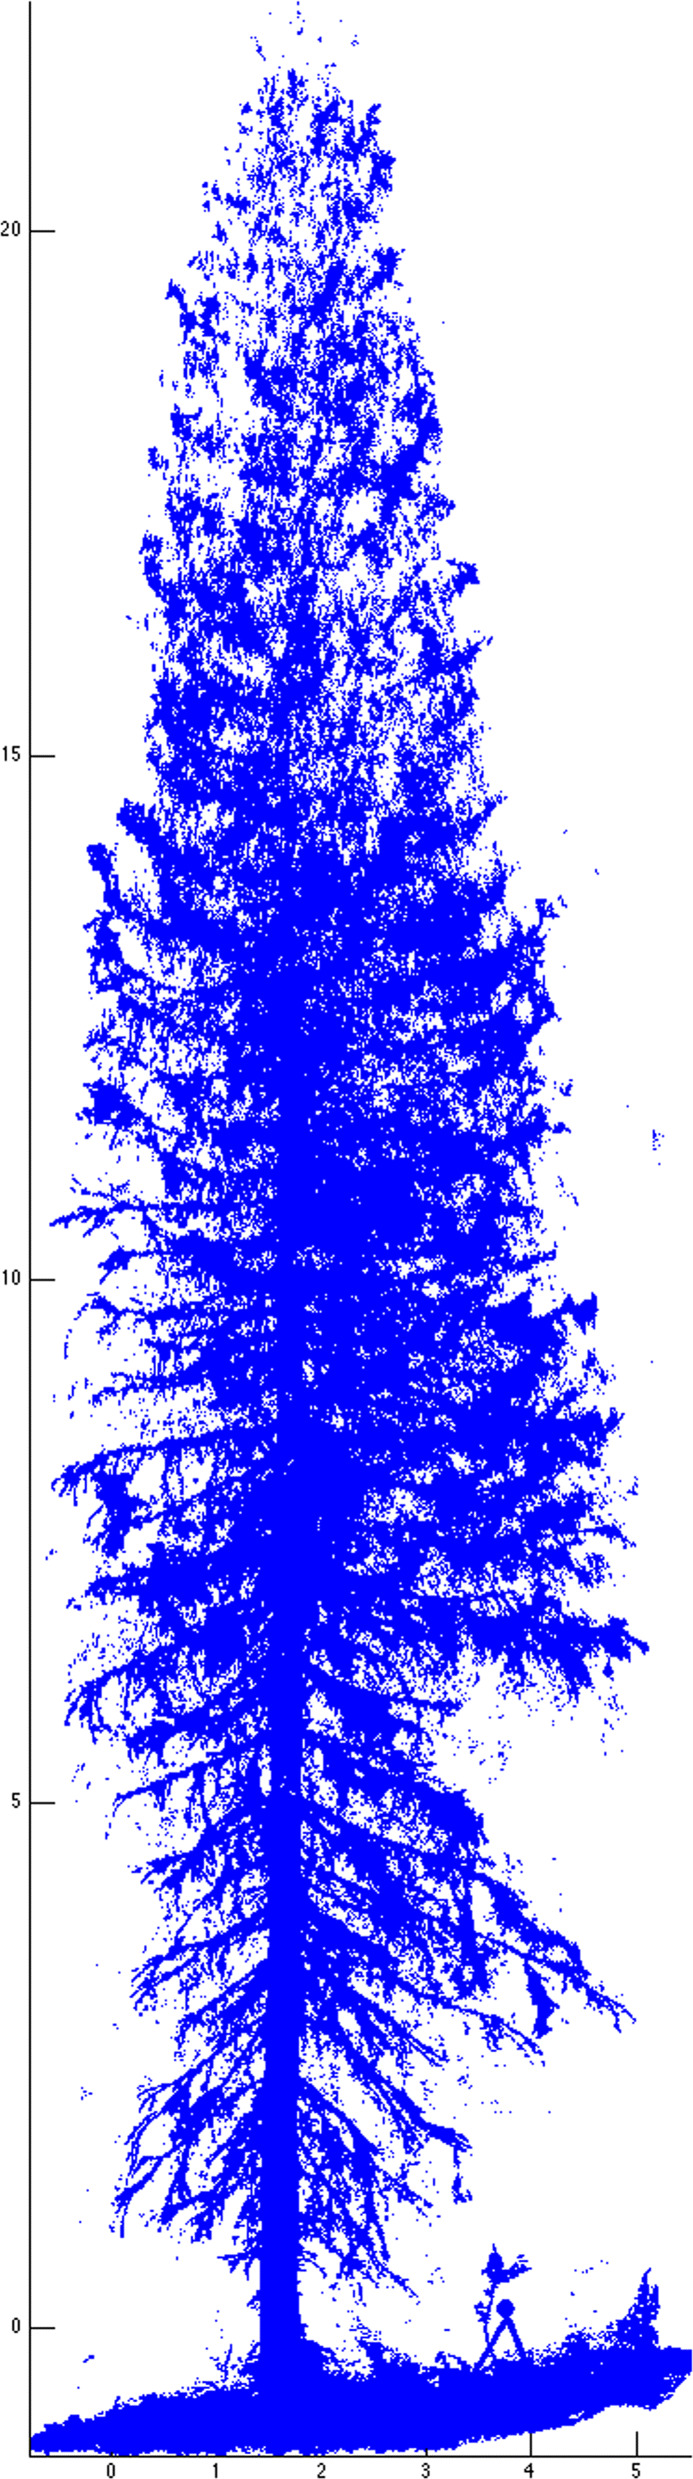
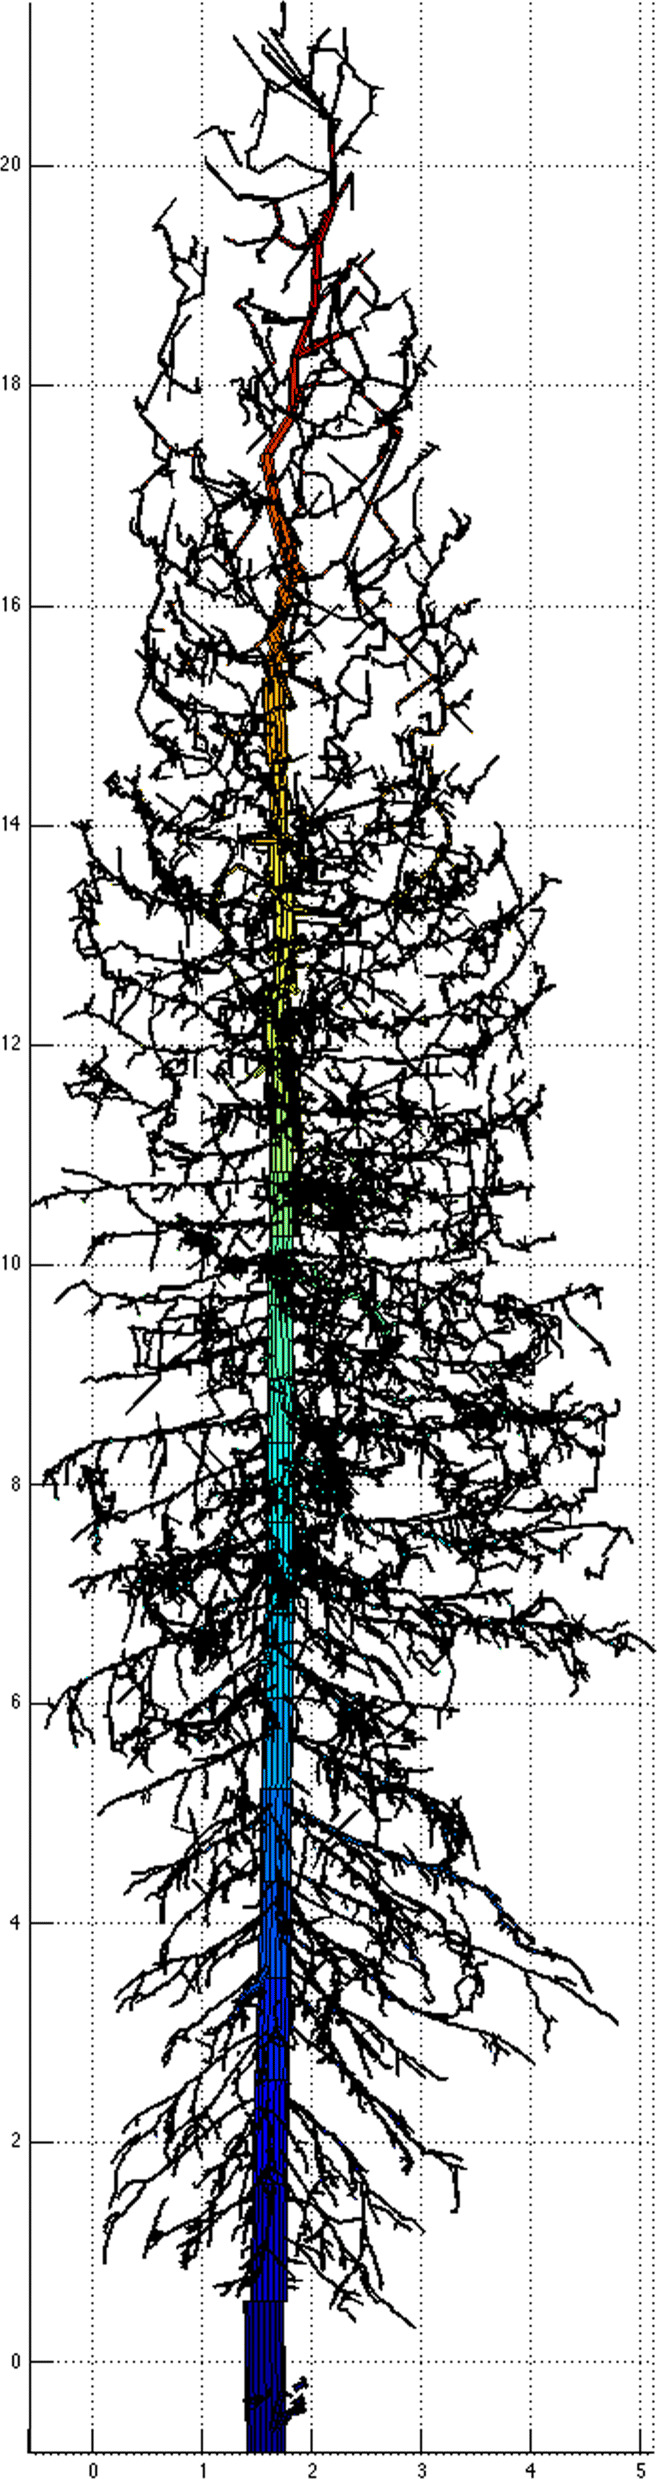
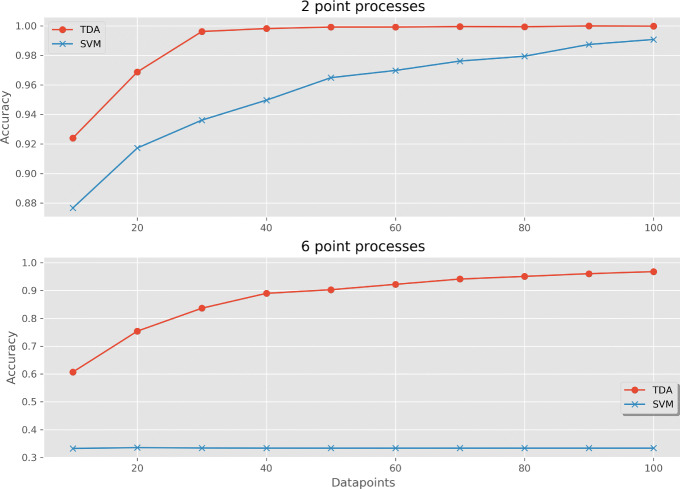
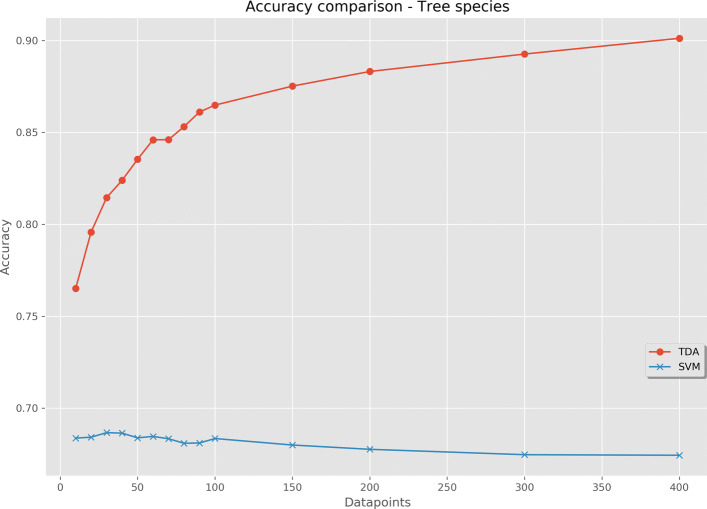
For 100 examples of 3 different tree species, the model reached 80% classification accuracy after 30 datapoints, which was improved to 90% after increased sampling to 400 datapoints. The alternative SVM classifier achieved a maximum accuracy of 68.7%. Using data from 100 examples from each class of 6 different random point processes, the classifier achieved 96.8% accuracy, vastly outperforming the SVM. Using two outcomes in neuron spiking data, the TDA classifier was similarly accurate to the SVM in one case (both converged to 97.8% accuracy), but was outperformed in the other (relative accuracies 79.8% and 92.2%, respectively).

CONCLUSIONS

This algorithm and software can be beneficial for repeated measurement data common in biological sciences, as both an accurate classifier and a feature selection tool.

摘要

背景

用于重复测量的机器学习模型有限。我们使用拓扑数据分析(TDA),提出了一种从数据空间中采样并基于数据拓扑构建网络图的重复测量分类器。然后应用具有交叉验证的机器学习模型进行分类。在三个案例研究中进行测试时,在大多数测试情况下,准确性超过了替代的支持向量机(SVM)投票模型,并且具有额外的优势,例如报告具有高纯度的数据子集以及特征值。

结果

对于 3 个不同树种的 100 个示例,在 30 个数据点后,该模型达到了 80%的分类准确性,在增加到 400 个数据点的采样后,准确性提高到了 90%。替代的 SVM 分类器的最大准确性达到了 68.7%。使用来自 6 种不同随机点过程的每个类别的 100 个示例的数据,分类器的准确性达到了 96.8%,大大优于 SVM。对于神经元尖峰数据的两个结果,在一种情况下,TDA 分类器与 SVM 的准确性相同(都收敛到 97.8%的准确性),但在另一种情况下表现更好(相对准确性分别为 79.8%和 92.2%)。

结论

该算法和软件可用于生物学中常见的重复测量数据,既是一种准确的分类器,也是一种特征选择工具。

https://cdn.ncbi.nlm.nih.gov/pmc/blobs/bb04/7392670/bf5b85038cd6/12859_2020_3659_Fig10_HTML.jpg
https://cdn.ncbi.nlm.nih.gov/pmc/blobs/bb04/7392670/a7a079e66d9b/12859_2020_3659_Fig1_HTML.jpg
https://cdn.ncbi.nlm.nih.gov/pmc/blobs/bb04/7392670/d7003cd62cc1/12859_2020_3659_Fig2_HTML.jpg
https://cdn.ncbi.nlm.nih.gov/pmc/blobs/bb04/7392670/718d940ca544/12859_2020_3659_Fig3_HTML.jpg
https://cdn.ncbi.nlm.nih.gov/pmc/blobs/bb04/7392670/84e1a3245751/12859_2020_3659_Fig4_HTML.jpg
https://cdn.ncbi.nlm.nih.gov/pmc/blobs/bb04/7392670/d7efe6a53725/12859_2020_3659_Fig5_HTML.jpg
https://cdn.ncbi.nlm.nih.gov/pmc/blobs/bb04/7392670/98ffa49d0e35/12859_2020_3659_Fig6_HTML.jpg
https://cdn.ncbi.nlm.nih.gov/pmc/blobs/bb04/7392670/4b69aab5a2a7/12859_2020_3659_Fig7_HTML.jpg
https://cdn.ncbi.nlm.nih.gov/pmc/blobs/bb04/7392670/05ce6b1b5b8a/12859_2020_3659_Fig8_HTML.jpg
https://cdn.ncbi.nlm.nih.gov/pmc/blobs/bb04/7392670/fbacfade9064/12859_2020_3659_Fig9_HTML.jpg
https://cdn.ncbi.nlm.nih.gov/pmc/blobs/bb04/7392670/bf5b85038cd6/12859_2020_3659_Fig10_HTML.jpg

相似文献

1
A topological data analysis based classification method for multiple measurements.基于拓扑数据分析的多测量分类方法。
BMC Bioinformatics. 2020 Jul 29;21(1):336. doi: 10.1186/s12859-020-03659-3.
2
A support vector machine classifier reduces interscanner variation in the HRCT classification of regional disease pattern in diffuse lung disease: comparison to a Bayesian classifier.支持向量机分类器减少了弥漫性肺疾病中区域性疾病模式 HRCT 分类中的扫描仪间变异性:与贝叶斯分类器的比较。
Med Phys. 2013 May;40(5):051912. doi: 10.1118/1.4802214.
3
Data-driven diagnosis of spinal abnormalities using feature selection and machine learning algorithms.基于特征选择和机器学习算法的脊柱异常数据驱动诊断。
PLoS One. 2020 Feb 6;15(2):e0228422. doi: 10.1371/journal.pone.0228422. eCollection 2020.
4
An Efficient Feature Selection Strategy Based on Multiple Support Vector Machine Technology with Gene Expression Data.基于基因表达数据的多支持向量机技术的高效特征选择策略。
Biomed Res Int. 2018 Aug 30;2018:7538204. doi: 10.1155/2018/7538204. eCollection 2018.
5
The construction of support vector machine classifier using the firefly algorithm.基于萤火虫算法的支持向量机分类器构建。
Comput Intell Neurosci. 2015;2015:212719. doi: 10.1155/2015/212719. Epub 2015 Feb 23.
6
Comparison of supervised machine learning classification techniques in prediction of locoregional recurrences in early oral tongue cancer.比较早期口腔舌癌局部区域复发预测中监督机器学习分类技术。
Int J Med Inform. 2020 Apr;136:104068. doi: 10.1016/j.ijmedinf.2019.104068. Epub 2019 Dec 28.
7
Cross-Voting SVM Method for Multiple Vehicle Classification in Wireless Sensor Networks.无线传感器网络中多车辆分类的交叉投票 SVM 方法。
Sensors (Basel). 2018 Sep 14;18(9):3108. doi: 10.3390/s18093108.
8
Ensemble support vector machine classification of dementia using structural MRI and mini-mental state examination.使用结构 MRI 和简易精神状态检查对痴呆进行集成支持向量机分类。
J Neurosci Methods. 2018 May 15;302:66-74. doi: 10.1016/j.jneumeth.2018.01.003. Epub 2018 Feb 3.
9
Wrapper method for feature selection to classify cardiac arrhythmia.用于心律失常分类的特征选择包装方法。
Annu Int Conf IEEE Eng Med Biol Soc. 2017 Jul;2017:3656-3659. doi: 10.1109/EMBC.2017.8037650.
10
Urban Tree Species Classification Using a WorldView-2/3 and LiDAR Data Fusion Approach and Deep Learning.利用 WorldView-2/3 和 LiDAR 数据融合方法及深度学习进行城市树种分类
Sensors (Basel). 2019 Mar 14;19(6):1284. doi: 10.3390/s19061284.

引用本文的文献

1
Topology of synaptic connectivity constrains neuronal stimulus representation, predicting two complementary coding strategies.突触连接的拓扑结构限制了神经元的刺激表示,预测了两种互补的编码策略。
PLoS One. 2022 Jan 12;17(1):e0261702. doi: 10.1371/journal.pone.0261702. eCollection 2022.
2
Identifying homogeneous subgroups of patients and important features: a topological machine learning approach.识别同质亚组患者和重要特征:拓扑机器学习方法。
BMC Bioinformatics. 2021 Sep 20;22(1):449. doi: 10.1186/s12859-021-04360-9.
3
Quantification of the Immune Content in Neuroblastoma: Deep Learning and Topological Data Analysis in Digital Pathology.

本文引用的文献

1
A Topological Representation of Branching Neuronal Morphologies.分支神经元形态的拓扑表示。
Neuroinformatics. 2018 Jan;16(1):3-13. doi: 10.1007/s12021-017-9341-1.
2
Cliques of Neurons Bound into Cavities Provide a Missing Link between Structure and Function.聚集在腔隙中的神经元小群体为结构与功能之间缺失的环节提供了线索。
Front Comput Neurosci. 2017 Jun 12;11:48. doi: 10.3389/fncom.2017.00048. eCollection 2017.
3
Persistent Homology Analysis of Brain Artery Trees.脑动脉树的持久同调分析
神经母细胞瘤中免疫成分的定量分析:数字病理学中的深度学习与拓扑数据分析
Int J Mol Sci. 2021 Aug 16;22(16):8804. doi: 10.3390/ijms22168804.
4
Benchmarking Datasets from Malaria Cytotoxic T-cell Epitopes Using Machine Learning Approach.使用机器学习方法对来自疟疾细胞毒性T细胞表位的基准数据集进行分析
Avicenna J Med Biotechnol. 2021 Apr-Jun;13(2):87-91. doi: 10.18502/ajmb.v13i2.5527.
5
The promise of machine learning in predicting treatment outcomes in psychiatry.机器学习在预测精神病学治疗结果方面的前景。
World Psychiatry. 2021 Jun;20(2):154-170. doi: 10.1002/wps.20882.
6
Using topological data analysis and pseudo time series to infer temporal phenotypes from electronic health records.使用拓扑数据分析和伪时间序列从电子健康记录中推断时间表型。
Artif Intell Med. 2020 Aug;108:101930. doi: 10.1016/j.artmed.2020.101930. Epub 2020 Jul 15.
Ann Appl Stat. 2016;10(1):198-218. doi: 10.1214/15-AOAS886. Epub 2016 Mar 25.
4
Identification of type 2 diabetes subgroups through topological analysis of patient similarity.通过患者相似性的拓扑分析识别2型糖尿病亚组。
Sci Transl Med. 2015 Oct 28;7(311):311ra174. doi: 10.1126/scitranslmed.aaa9364.
5
Reconstruction and Simulation of Neocortical Microcircuitry.重建与模拟新皮层微电路
Cell. 2015 Oct 8;163(2):456-92. doi: 10.1016/j.cell.2015.09.029.
6
Comparing and distinguishing the structure of biological branching.比较和区分生物分支的结构。
J Theor Biol. 2015 Jan 21;365:226-37. doi: 10.1016/j.jtbi.2014.10.001. Epub 2014 Oct 13.
7
Topology based data analysis identifies a subgroup of breast cancers with a unique mutational profile and excellent survival.基于拓扑数据分析的方法鉴定出具有独特突变特征和良好预后的乳腺癌亚群。
Proc Natl Acad Sci U S A. 2011 Apr 26;108(17):7265-70. doi: 10.1073/pnas.1102826108. Epub 2011 Apr 11.
8
A multiscale model of plant topological structures.植物拓扑结构的多尺度模型。
J Theor Biol. 1998 Mar 7;191(1):1-46. doi: 10.1006/jtbi.1997.0561.