• 文献检索
  • 文档翻译
  • 深度研究
  • 学术资讯
  • Suppr Zotero 插件Zotero 插件
  • 邀请有礼
  • 套餐&价格
  • 历史记录
应用&插件
Suppr Zotero 插件Zotero 插件浏览器插件Mac 客户端Windows 客户端微信小程序
定价
高级版会员购买积分包购买API积分包
服务
文献检索文档翻译深度研究API 文档MCP 服务
关于我们
关于 Suppr公司介绍联系我们用户协议隐私条款
关注我们

Suppr 超能文献

核心技术专利:CN118964589B侵权必究
粤ICP备2023148730 号-1Suppr @ 2026

文献检索

告别复杂PubMed语法,用中文像聊天一样搜索,搜遍4000万医学文献。AI智能推荐,让科研检索更轻松。

立即免费搜索

文件翻译

保留排版,准确专业,支持PDF/Word/PPT等文件格式,支持 12+语言互译。

免费翻译文档

深度研究

AI帮你快速写综述,25分钟生成高质量综述,智能提取关键信息,辅助科研写作。

立即免费体验

雅鲁藏布江中游宽谷区的年际和年内风速变化。

Inter- and intra-annual wind speed variabilities in wide valley regions of the middle reaches of the Yarlung Tsangpo River, China.

机构信息

State Key Laboratory of Water Resources and Hydropower Engineering Science, Wuhan University, Wuhan, 430072, China.

Changjiang Institute of Survey, Planning, Design and Research, Wuhan, 430010, China.

出版信息

Sci Rep. 2020 Jul 29;10(1):12657. doi: 10.1038/s41598-020-69392-2.

DOI:10.1038/s41598-020-69392-2
PMID:32728170
原文链接:https://pmc.ncbi.nlm.nih.gov/articles/PMC7392765/
Abstract

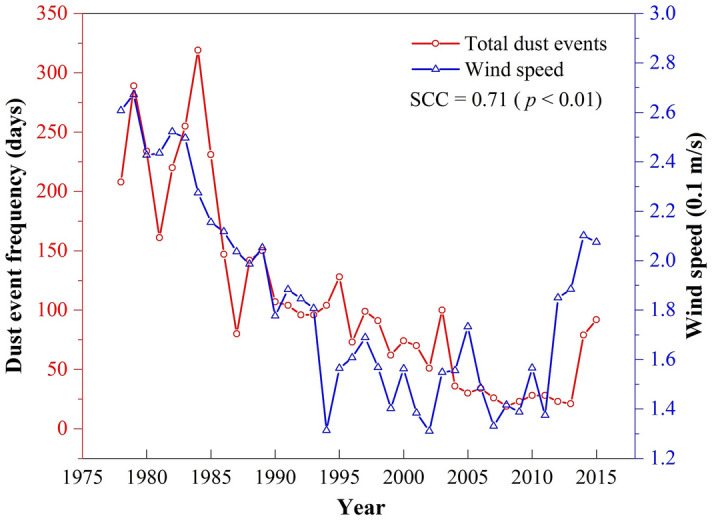
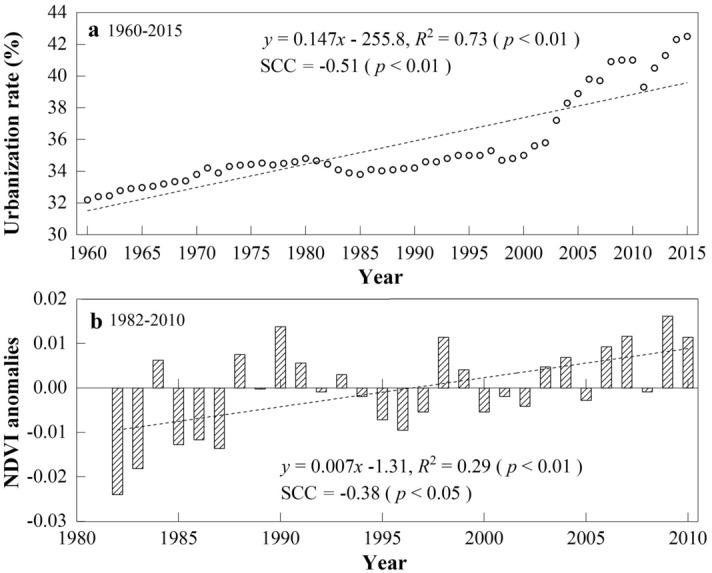
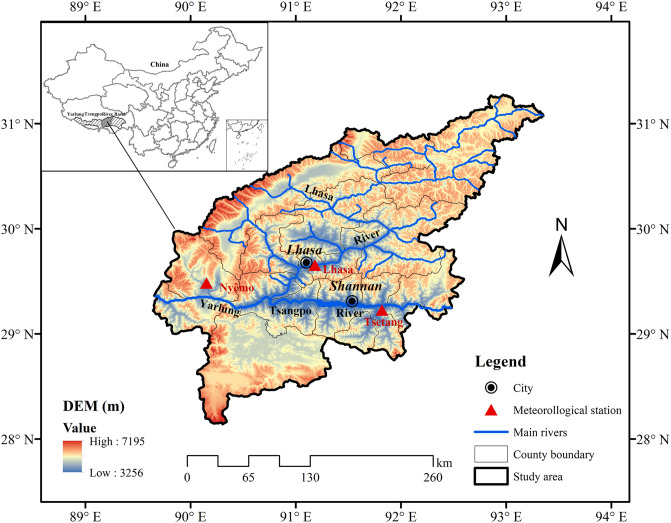
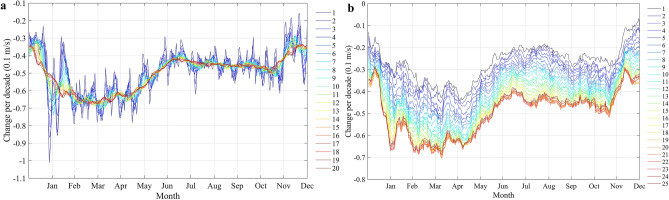
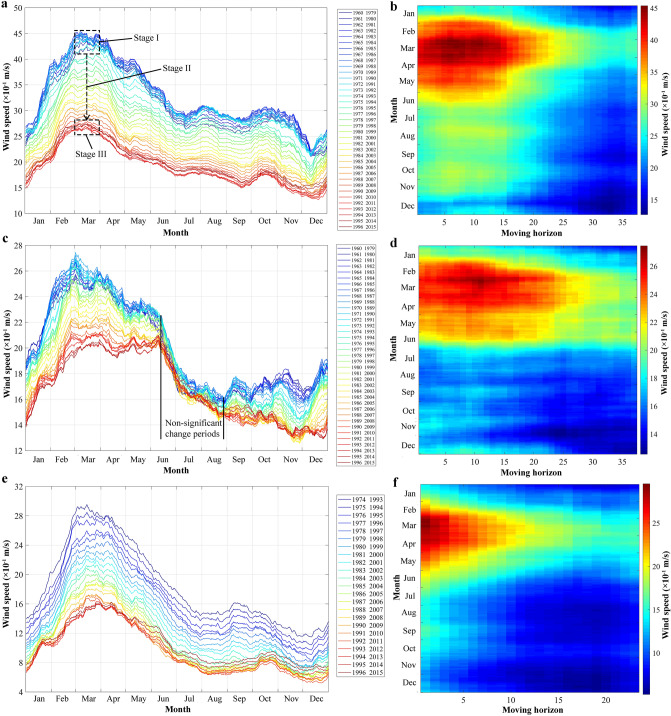
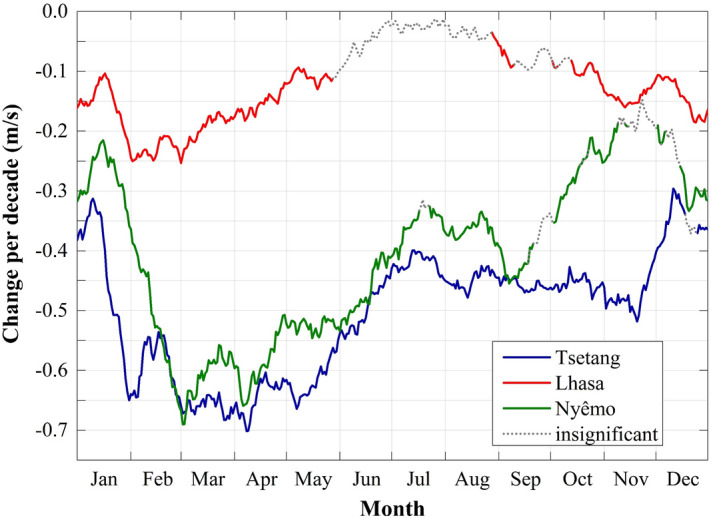
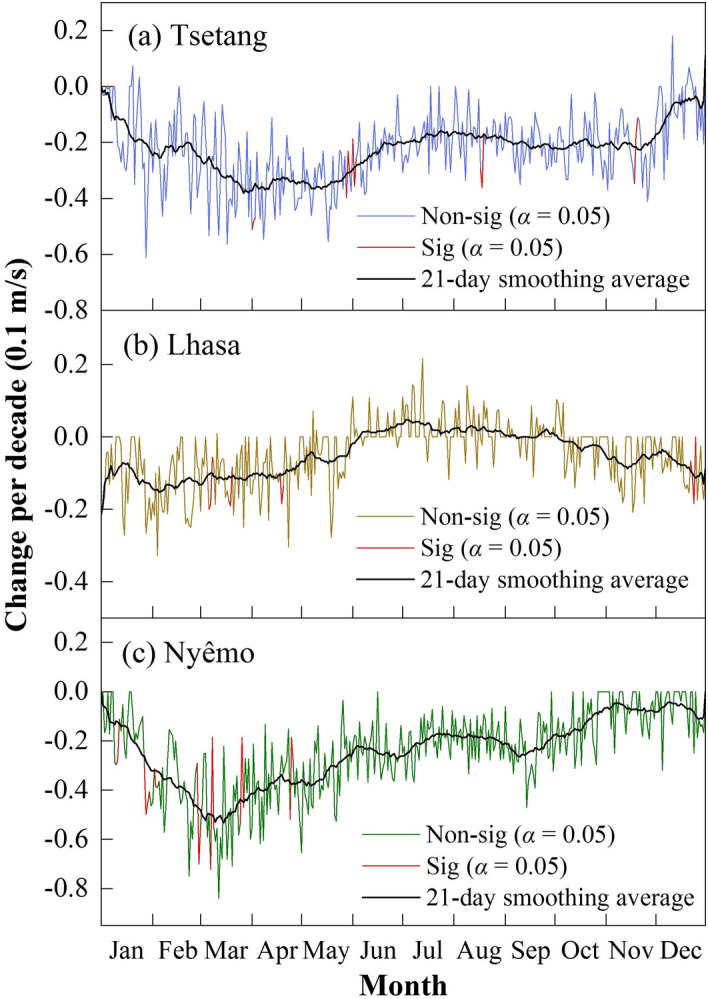
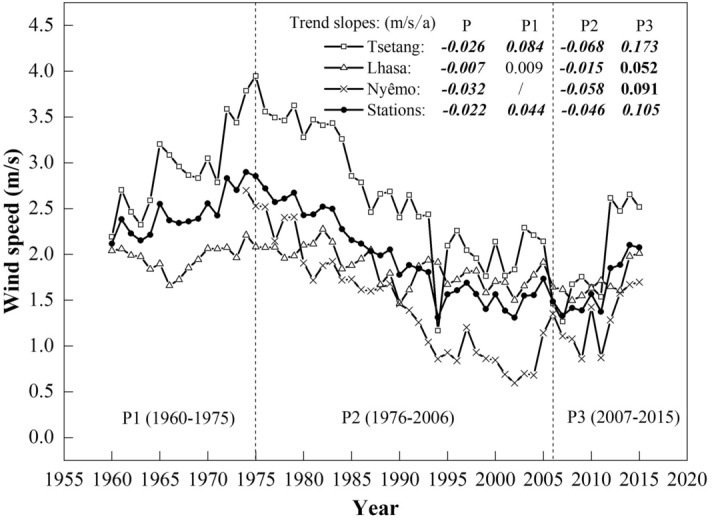
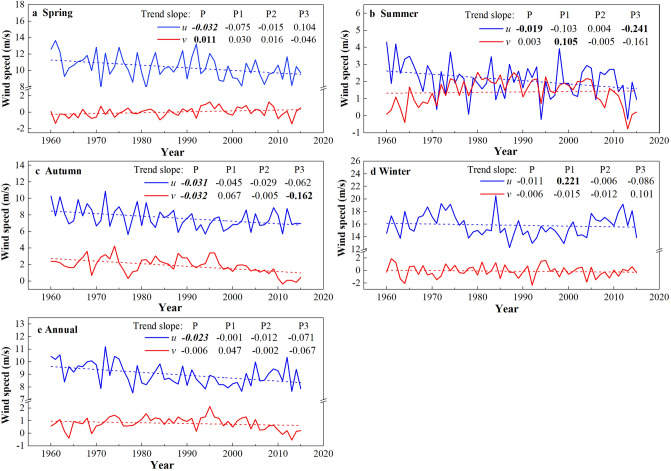
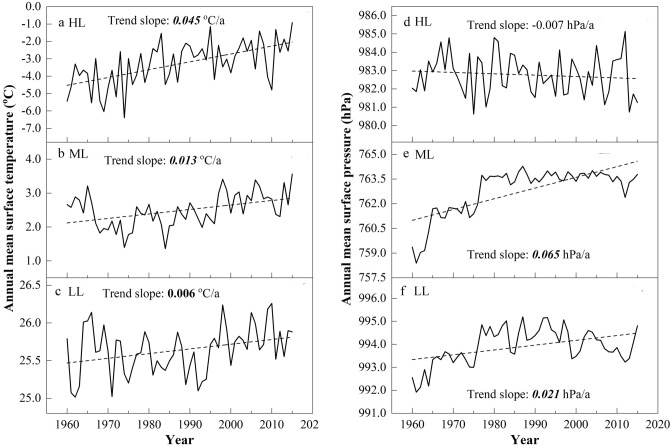
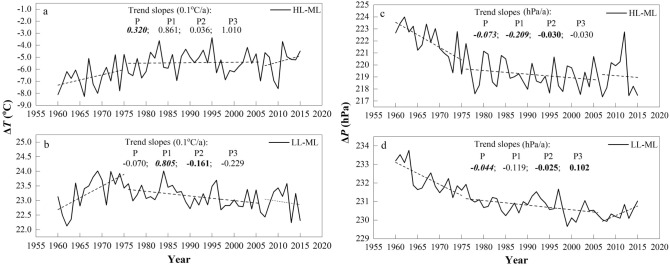
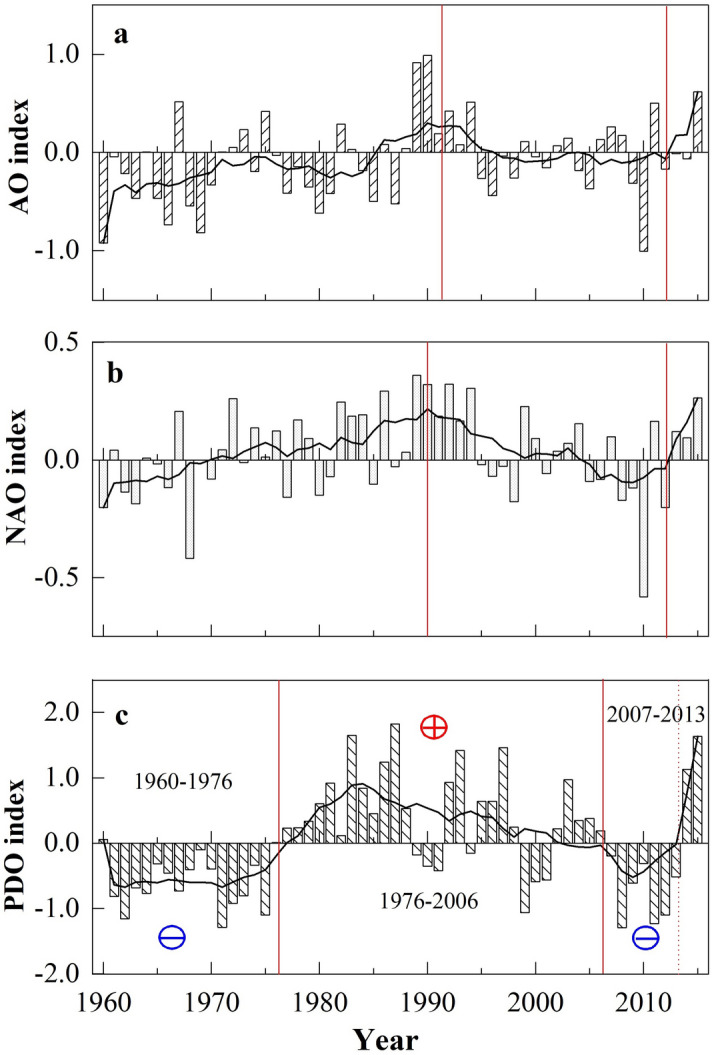
Wind speed and variability are the most critical climatic factors affecting sand/dust storms, which have not been sufficiently studied in the middle reaches of the Yarlung Tsangpo River (MYR). In this study, wind speed variability was investigated using the moving average over shifting horizon method (MASH), combined with the modified Mann-Kendall test and Sen's slope based on data from the Tsetang, Lhasa, and Nyêmo meteorological stations during 1960-2015. The results indicated that annual wind speeds for the MYR wide valley regions declined significantly at decadal rates of - 0.216 m/s and underwent three stages from 1960 to 2015: an increasing trend from 1960 to 1975 (0.44 m/s per decade), a weakening until 2006 (- 0.46 m/s per decade), and a remarkable subsequent recovery (1.05 m/s per decade). Different variability trends were observed for the three stations: wind speed decreased significantly during all months at the Tsetang and Nyêmo stations, particularly in the spring, while for Lhasa, a non-significant wind speed increase was detected in summer, and the highest decline occurred in winter. The MASH method resulted in the effective visualization of different patterns, making seasonal process analysis and trend detection easier. In addition, the possible main causes for wind speed change were also discussed. The wind speed change in the study region was strongly associated with the large-scale atmospheric patterns, and the surface pressure gradient variability between the mid and low latitudes may have been a primary driving force. Positive/negative phases of the Pacific Decadal Oscillation (PDO) corresponded well with wind speed decreases/increases and were regarded as an indicator of wind speed variations. The effects of human activities associated with surface roughness change in the MYR were minor compared with the climatic changes.

摘要

风速和变率是影响风沙天气的最关键气候因素,但在雅鲁藏布江中游(MYR)地区,这些因素并未得到充分研究。本研究采用移动平均转移窗口方法(MASH)结合修正的Mann-Kendall 检验和 Sen 斜率,对 1960-2015 年来自 Tsetang、拉萨和 Nyêmo 气象站的数据进行风速变率分析。结果表明,MYR 宽谷地区的年风速以每十年-0.216 m/s 的速度显著下降,并在 1960 年至 2015 年经历了三个阶段:从 1960 年到 1975 年呈上升趋势(每十年 0.44 m/s),1975 年到 2006 年减弱(每十年-0.46 m/s),随后显著恢复(每十年 1.05 m/s)。三个气象站的风速变化趋势不同:Tsetang 和 Nyêmo 气象站所有月份的风速都显著下降,特别是在春季,而拉萨气象站夏季风速呈非显著上升趋势,冬季风速下降最大。MASH 方法有效地可视化了不同的模式,使季节性过程分析和趋势检测更加容易。此外,还讨论了风速变化的可能主要原因。研究区域的风速变化与大尺度大气模式密切相关,中低纬度之间的地表气压梯度变化可能是主要驱动力。太平洋年代际振荡(PDO)的正/负相位与风速下降/上升很好地对应,被视为风速变化的指标。与气候变化相比,与 MYR 地表粗糙度变化相关的人类活动的影响较小。

https://cdn.ncbi.nlm.nih.gov/pmc/blobs/cbbf/7392765/cd35f748bed7/41598_2020_69392_Fig13_HTML.jpg
https://cdn.ncbi.nlm.nih.gov/pmc/blobs/cbbf/7392765/93233083de98/41598_2020_69392_Fig1_HTML.jpg
https://cdn.ncbi.nlm.nih.gov/pmc/blobs/cbbf/7392765/591e7580314f/41598_2020_69392_Fig2_HTML.jpg
https://cdn.ncbi.nlm.nih.gov/pmc/blobs/cbbf/7392765/6bff09535d36/41598_2020_69392_Fig3_HTML.jpg
https://cdn.ncbi.nlm.nih.gov/pmc/blobs/cbbf/7392765/86bfea8ecfe8/41598_2020_69392_Fig4_HTML.jpg
https://cdn.ncbi.nlm.nih.gov/pmc/blobs/cbbf/7392765/50fa0959d053/41598_2020_69392_Fig5_HTML.jpg
https://cdn.ncbi.nlm.nih.gov/pmc/blobs/cbbf/7392765/a45c5bd4c0a4/41598_2020_69392_Fig6_HTML.jpg
https://cdn.ncbi.nlm.nih.gov/pmc/blobs/cbbf/7392765/b657ae32c8d0/41598_2020_69392_Fig7_HTML.jpg
https://cdn.ncbi.nlm.nih.gov/pmc/blobs/cbbf/7392765/dc9e95e5ed7a/41598_2020_69392_Fig8_HTML.jpg
https://cdn.ncbi.nlm.nih.gov/pmc/blobs/cbbf/7392765/52654e38279b/41598_2020_69392_Fig9_HTML.jpg
https://cdn.ncbi.nlm.nih.gov/pmc/blobs/cbbf/7392765/0cfd8c837813/41598_2020_69392_Fig10_HTML.jpg
https://cdn.ncbi.nlm.nih.gov/pmc/blobs/cbbf/7392765/1373391c5be3/41598_2020_69392_Fig11_HTML.jpg
https://cdn.ncbi.nlm.nih.gov/pmc/blobs/cbbf/7392765/38342f0af9a3/41598_2020_69392_Fig12_HTML.jpg
https://cdn.ncbi.nlm.nih.gov/pmc/blobs/cbbf/7392765/cd35f748bed7/41598_2020_69392_Fig13_HTML.jpg

相似文献

1
Inter- and intra-annual wind speed variabilities in wide valley regions of the middle reaches of the Yarlung Tsangpo River, China.雅鲁藏布江中游宽谷区的年际和年内风速变化。
Sci Rep. 2020 Jul 29;10(1):12657. doi: 10.1038/s41598-020-69392-2.
2
Spatiotemporal variation of potential evapotranspiration and its dominant factors during 1970-2020 across the Sichuan-Chongqing region, China.中国川渝地区 1970-2020 年潜在蒸散量的时空变化及其主导因素。
PLoS One. 2022 Jun 24;17(6):e0268702. doi: 10.1371/journal.pone.0268702. eCollection 2022.
3
Temporal and Spatial Variation (2001-2020) Characteristics of Wind Speed in the Water Erosion Area of the Typical Black Soil Region, Northeast China.典型黑土区东北风蚀区风速时空变化(2001-2020 年)特征
Int J Environ Res Public Health. 2022 Aug 23;19(17):10473. doi: 10.3390/ijerph191710473.
4
[Dust storms trend in the Capital Circle of China over the past 50 years and its correlation with temperature, precipitation and wind].中国首都圈近50年沙尘暴趋势及其与气温、降水和风速的相关性
Huan Jing Ke Xue. 2005 Jan;26(1):32-7.
5
Wind Dynamic Characteristics and Wind Tunnel Simulation of Subgrade Sand Hazard in the Shannan Wide Valley of the Sichuan-Tibet Railway.川藏铁路山南宽谷段路基风沙灾害风动力特性及风洞模拟
Int J Environ Res Public Health. 2022 Jul 8;19(14):8341. doi: 10.3390/ijerph19148341.
6
Seasonality, interannual variability, and linear tendency of wind speeds in the northeast Brazil from 1986 to 2011.1986年至2011年巴西东北部风速的季节性、年际变化和线性趋势
ScientificWorldJournal. 2013 Oct 22;2013:490857. doi: 10.1155/2013/490857. eCollection 2013.
7
Assessment of spatiotemporal variability and trend analysis of reference crop evapotranspiration for the southern region of Peninsular India.评估印度半岛南部参考作物蒸散量的时空变异性和趋势分析。
Environ Sci Pollut Res Int. 2022 Jun;29(28):41953-41970. doi: 10.1007/s11356-021-15958-0. Epub 2021 Aug 18.
8
Spatial-temporal variations of reference evapotranspiration and its driving factors in cold regions, northeast China.中国东北寒冷地区参考蒸散量的时空变化及其驱动因素
Environ Sci Pollut Res Int. 2022 May;29(24):36951-36966. doi: 10.1007/s11356-021-18133-7. Epub 2022 Jan 23.
9
Detection of changes and trends in climatic variables in Bangladesh during 1988-2017.1988 - 2017年孟加拉国气候变量变化及趋势检测
Heliyon. 2019 Mar 20;5(3):e01268. doi: 10.1016/j.heliyon.2019.e01268. eCollection 2019 Mar.
10
Meteorological driving forces of reference evapotranspiration and their trends in California.加利福尼亚参考蒸散的气象驱动因素及其趋势。
Sci Total Environ. 2022 Nov 25;849:157823. doi: 10.1016/j.scitotenv.2022.157823. Epub 2022 Aug 3.

引用本文的文献

1
Urbanization Effects on Surface Wind in the Guangdong-Hong Kong-Macao Greater Bay Area Using a Fan-Sector Method.利用扇形区域法研究粤港澳大湾区城市化对地表风的影响
Int J Environ Res Public Health. 2022 Mar 8;19(6):3194. doi: 10.3390/ijerph19063194.

本文引用的文献

1
Temporal and spatial variations in sand and dust storm events in East Asia from 2007 to 2016: Relationships with surface conditions and climate change.2007 年至 2016 年东亚地区沙尘天气事件的时空变化:与地表状况和气候变化的关系。
Sci Total Environ. 2018 Aug 15;633:452-462. doi: 10.1016/j.scitotenv.2018.03.068. Epub 2018 Mar 28.
2
Evidence for a significant urbanization effect on climate in China.中国城市化对气候产生显著影响的证据。
Proc Natl Acad Sci U S A. 2004 Jun 29;101(26):9540-4. doi: 10.1073/pnas.0400357101. Epub 2004 Jun 17.
3
The proof and measurement of association between two things. By C. Spearman, 1904.
两件事物之间关联的证明与度量。作者C. 斯皮尔曼,1904年。
Am J Psychol. 1987 Fall-Winter;100(3-4):441-71.
4
Proof without prejudice: use of the Kolmogorov-Smirnov test for the analysis of histograms from flow systems and other sources.无偏见证明:使用柯尔莫哥洛夫-斯米尔诺夫检验分析来自流动系统及其他来源的直方图。
J Histochem Cytochem. 1977 Jul;25(7):935-41. doi: 10.1177/25.7.894009.