MMWR Morb Mortal Wkly Rep. 2020 Sep 18;69(37):1313-1318. doi: 10.15585/mmwr.mm6937e2.
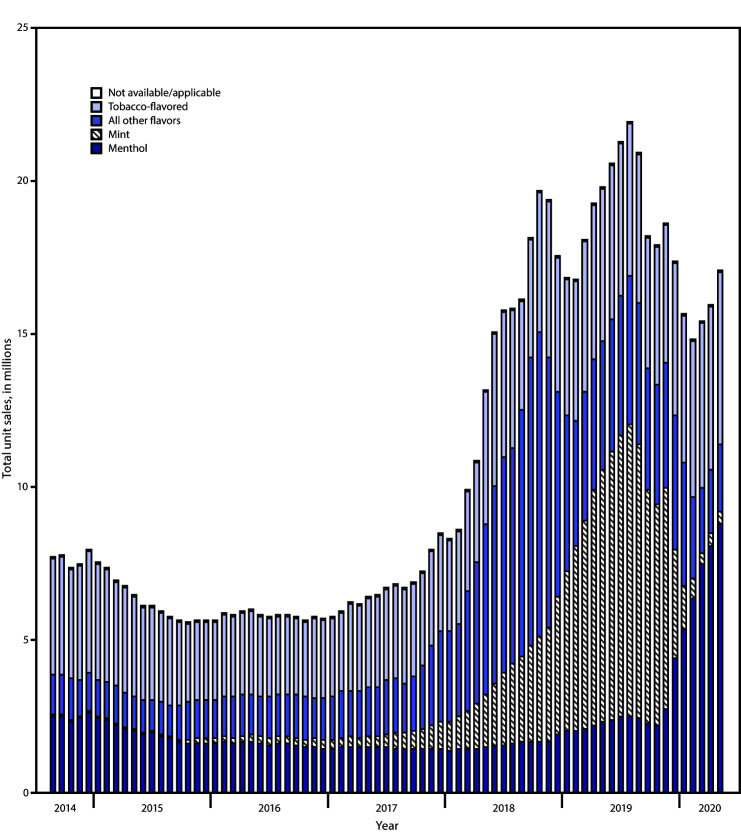
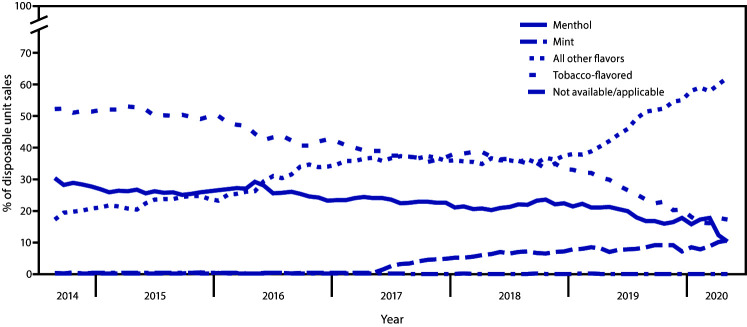
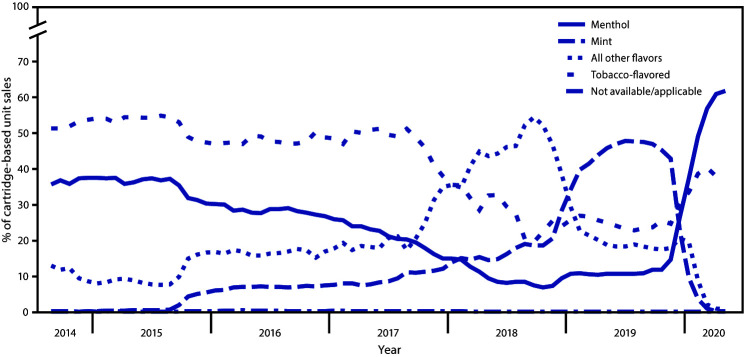
Since electronic cigarettes (e-cigarettes) entered the U.S. marketplace in 2007, the landscape has evolved to include different product types (e.g., prefilled cartridge-based and disposable products) and flavored e-liquids (e.g., fruit, candy, mint, menthol, and tobacco flavors), which have contributed to increases in youth use (1,2). E-cigarettes have been the most commonly used tobacco product among U.S. youths since 2014; in 2019, 27.5% of high school students reported current e-cigarette use (3). To assess trends in unit sales of e-cigarettes in the United States by product and flavor type, CDC, CDC Foundation, and Truth Initiative analyzed retail scanner data during September 14, 2014-May 17, 2020, from Information Resources, Inc. (IRI). During this period, total e-cigarette sales increased by 122.2%, from 7.7 million to 17.1 million units per 4-week interval. By product type, the proportion of total sales that was prefilled cartridge products increased during September 2014-August 2019 (47.5% to 89.4%). During August 2019-May 2020, the proportion of total sales that was disposable products increased from 10.3% to 19.8%, while the proportion that was prefilled cartridge products decreased (89.4% to 80.2%). Among prefilled cartridge sales, the proportion of mint sales increased during September 2014-August 2019 (<0.1% to 47.6%); during August 2019-May 2020, mint sales decreased (47.6% to 0.3%), as menthol sales increased (10.7% to 61.8%). Among disposable e-cigarette sales during September 2014-May 2020, the proportion of mint sales increased (<0.1% to 10.5%), although tobacco-flavored (52.2% to 17.2%) and menthol-flavored (30.3% to 10.2%) sales decreased; during the same period, sales of all other flavors combined increased (17.2% to 62.1%). E-cigarette sales increased during 2014-2020, but fluctuations occurred overall and by product and flavor type, which could be attributed to consumer preferences and accessibility. Continued monitoring of e-cigarette sales and use is critical to inform strategies at the national, state, and community levels to minimize the risks of e-cigarettes on individual- and population-level health. As part of a comprehensive approach to prevent and reduce youth e-cigarettes use, such strategies could include those that address youth-appealing product innovations and flavors.
自 2007 年电子烟进入美国市场以来,其产品种类(例如预充式墨盒产品和一次性产品)和口味电子烟液(例如水果、糖果、薄荷、薄荷醇和烟草口味)不断演变,这导致青少年使用电子烟的比例增加(1,2)。自 2014 年以来,电子烟一直是美国青少年最常使用的烟草产品;2019 年,有 27.5%的高中生报告目前使用电子烟(3)。为评估 2014 年 9 月 14 日至 2020 年 5 月 17 日期间美国电子烟产品按产品和口味类型的单位销售趋势,疾病预防控制中心、疾病预防控制中心基金会和真相倡议组织分析了来自 Information Resources,Inc.(IRI)的零售扫描器数据。在此期间,电子烟总销量增长了 122.2%,每 4 周间隔的销售量从 770 万支增加到 1710 万支。按产品类型划分,2014 年 9 月至 2019 年 8 月期间,预充式墨盒产品在总销售额中的占比增加(47.5%至 89.4%)。2019 年 8 月至 2020 年 5 月期间,一次性产品在总销售额中的占比从 10.3%增加到 19.8%,而预充式墨盒产品的占比下降(89.4%至 80.2%)。在预充式墨盒销售中,薄荷味的销售比例在 2014 年 9 月至 2019 年 8 月期间有所增加(<0.1%至 47.6%);2019 年 8 月至 2020 年 5 月期间,薄荷味的销售比例下降(47.6%至 0.3%),而薄荷醇味的销售比例上升(10.7%至 61.8%)。在 2014 年 9 月至 2020 年 5 月期间的一次性电子烟销售中,薄荷味的销售比例有所增加(<0.1%至 10.5%),尽管烟草味(52.2%至 17.2%)和薄荷醇味(30.3%至 10.2%)的销售有所下降;在此期间,所有其他口味的销售总和增加(17.2%至 62.1%)。2014 年至 2020 年期间,电子烟销量有所增加,但总体和按产品及口味类型波动,这可能归因于消费者偏好和产品可及性。持续监测电子烟销售和使用情况对于在国家、州和社区各级制定策略以最大限度地减少电子烟对个人和人群健康的风险至关重要。作为预防和减少青少年电子烟使用的综合策略的一部分,此类策略可能包括针对吸引青少年的产品创新和口味的策略。