• 文献检索
  • 文档翻译
  • 深度研究
  • 学术资讯
  • Suppr Zotero 插件Zotero 插件
  • 邀请有礼
  • 套餐&价格
  • 历史记录
应用&插件
Suppr Zotero 插件Zotero 插件浏览器插件Mac 客户端Windows 客户端微信小程序
定价
高级版会员购买积分包购买API积分包
服务
文献检索文档翻译深度研究API 文档MCP 服务
关于我们
关于 Suppr公司介绍联系我们用户协议隐私条款
关注我们

Suppr 超能文献

核心技术专利:CN118964589B侵权必究
粤ICP备2023148730 号-1Suppr @ 2026

文献检索

告别复杂PubMed语法,用中文像聊天一样搜索,搜遍4000万医学文献。AI智能推荐,让科研检索更轻松。

立即免费搜索

文件翻译

保留排版,准确专业,支持PDF/Word/PPT等文件格式,支持 12+语言互译。

免费翻译文档

深度研究

AI帮你快速写综述,25分钟生成高质量综述,智能提取关键信息,辅助科研写作。

立即免费体验

不同环境保护政策下中国白洋淀流域农业面源污染的估算。

Estimation of potential agricultural non-point source pollution for Baiyangdian Basin, China, under different environment protection policies.

机构信息

State Key Laboratory of Simulation and Regulation of Water Cycle in River Basin, China Institute of Water Resources and Hydropower Research, Beijing, China.

Department of Irrigation and Drainage, China Institute of Water Resources and Hydropower Research, Beijing, China.

出版信息

PLoS One. 2020 Sep 22;15(9):e0239006. doi: 10.1371/journal.pone.0239006. eCollection 2020.

DOI:10.1371/journal.pone.0239006
PMID:32960903
原文链接:https://pmc.ncbi.nlm.nih.gov/articles/PMC7508407/
Abstract

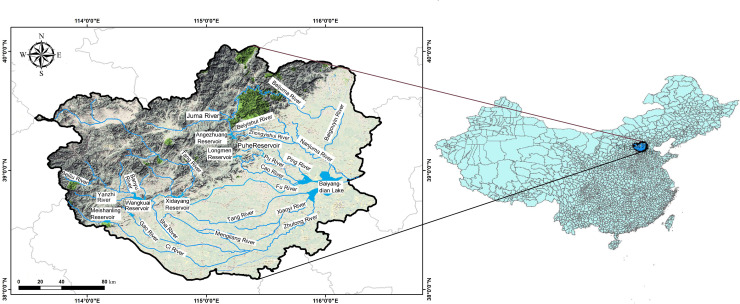
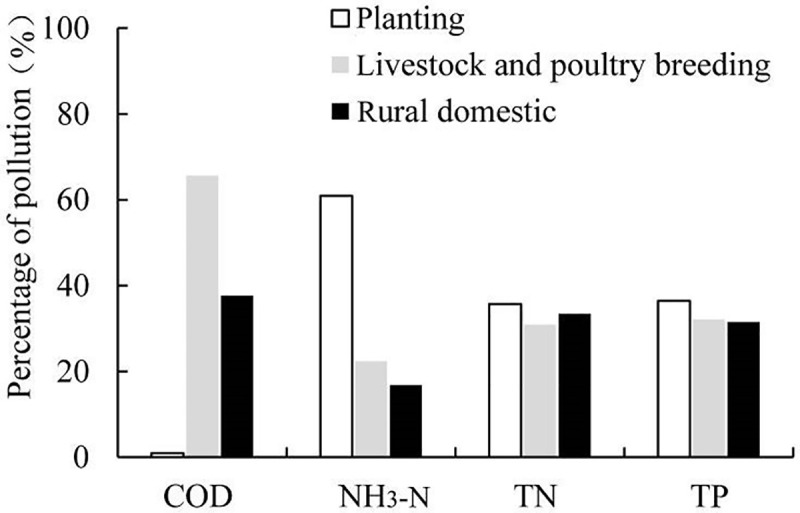
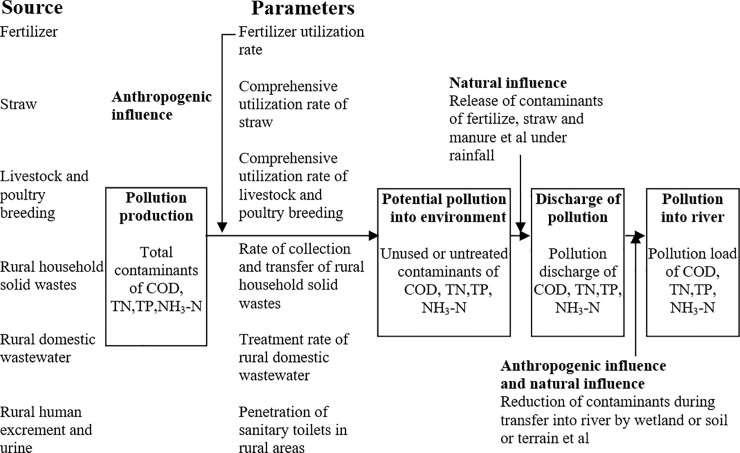
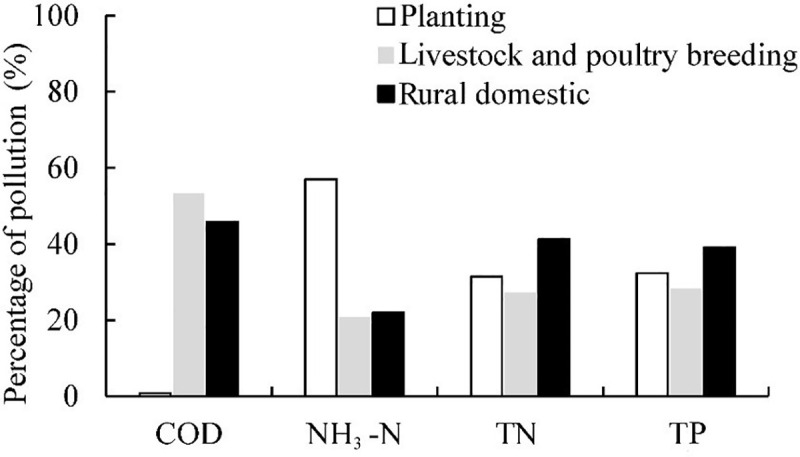
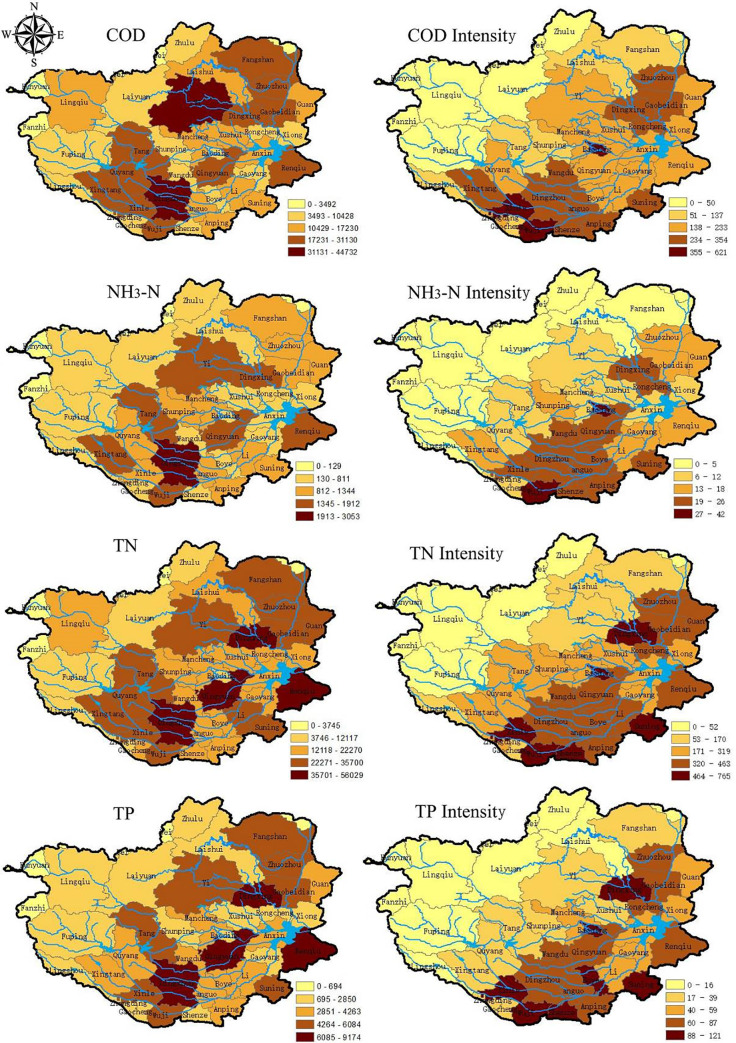
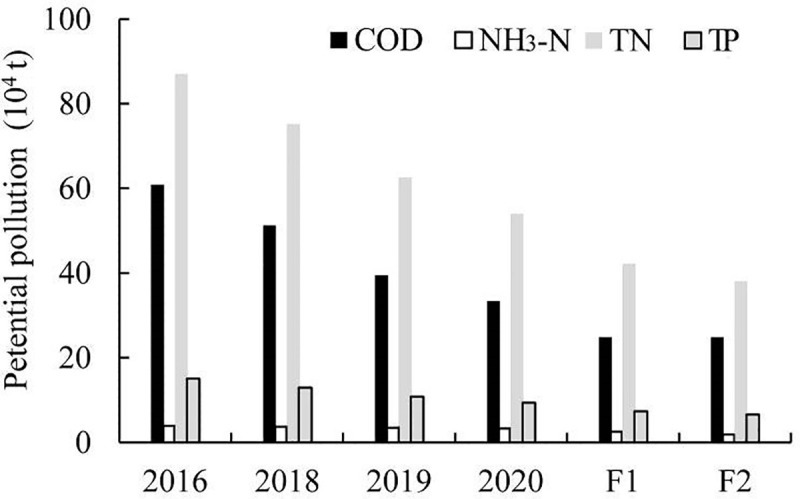
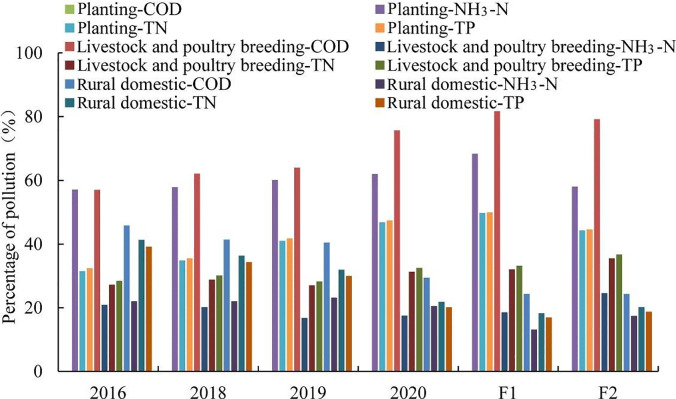
To prevent and control non-point source pollution, many policies have been carried out by government in China. However, the effectiveness of these policies has rarely been evaluated. In this study, the potential and spatial distribution of agricultural non-point source pollution in the Baiyangdian Basin are reported. This investigation considers multiple parameters under various policies with county as a basic unit. The results for the potential pollution from chemical oxygen demand (COD), ammonia nitrogen (NH3-N), total nitrogen (TN) and total phosphorus (TP) are 60.89×10⁴, 3.93×10⁴, 87.05×10⁴ and 15.10×10⁴ Mg, with corresponding intensities of 190, 12, 272 and 47 kg ha-1 for the Baiyangdian Basin in 2016. The highest pollution from COD is attributed to livestock and poultry breeding, whereas TN and TP are dominantly produced by rural domestic sources, and NH3-N is mostly derived from planting. Spatially, distribution of the counties producing larger non-point source pollution presented a northeast to southwest direction, consistent with the Taihang mountain alignment in the basin. The counties with high pollution intensities are mostly in the south and east of the basin. Agricultural non-point source pollution control and prevention policies contributed in pollution reduction. Compared with 2016, the total potential pollution of COD, NH3-N, TN and TP in 2020 decrease by 45.1%, 14.7%, 37.9% and 37.4%, respectively, whereas for an assumed future time (F2), the decreases are 59%, 51.4%, 56.2% and 55.7%, respectively. Prevention measures should focus on reducing pollution from livestock and poultry breeding as well as planting.

摘要

为了防治非点源污染,中国政府已经实施了许多政策。然而,这些政策的效果很少得到评估。本研究报告了白洋淀流域农业非点源污染的潜力和空间分布。本研究以县为基本单元,考虑了多种政策下的多个参数。2016 年白洋淀流域化学需氧量(COD)、氨氮(NH3-N)、总氮(TN)和总磷(TP)的潜在污染分别为 60.89×10⁴、3.93×10⁴、87.05×10⁴和 15.10×10⁴ Mg,相应的强度分别为 190、12、272 和 47 kg ha-1。COD 的最大污染来自于畜禽养殖,而 TN 和 TP 主要来自农村生活源,NH3-N 主要来自种植业。空间上,产生较大非点源污染的县域分布呈东北-西南方向,与流域内的太行山脉走向一致。高污染强度的县域主要分布在流域的南部和东部。农业非点源污染控制和防治政策在污染减排方面发挥了作用。与 2016 年相比,2020 年 COD、NH3-N、TN 和 TP 的总潜在污染分别减少了 45.1%、14.7%、37.9%和 37.4%,而在假设的未来时间(F2),减少了 59%、51.4%、56.2%和 55.7%。预防措施应重点减少畜禽养殖和种植业的污染。

https://cdn.ncbi.nlm.nih.gov/pmc/blobs/3c83/7508407/4bb8c40fe1be/pone.0239006.g007.jpg
https://cdn.ncbi.nlm.nih.gov/pmc/blobs/3c83/7508407/7a1e93b4e2a7/pone.0239006.g001.jpg
https://cdn.ncbi.nlm.nih.gov/pmc/blobs/3c83/7508407/d4032cd26def/pone.0239006.g002.jpg
https://cdn.ncbi.nlm.nih.gov/pmc/blobs/3c83/7508407/29f551412de7/pone.0239006.g003.jpg
https://cdn.ncbi.nlm.nih.gov/pmc/blobs/3c83/7508407/82d507823f15/pone.0239006.g004.jpg
https://cdn.ncbi.nlm.nih.gov/pmc/blobs/3c83/7508407/3115c3b43e41/pone.0239006.g005.jpg
https://cdn.ncbi.nlm.nih.gov/pmc/blobs/3c83/7508407/3093b669b514/pone.0239006.g006.jpg
https://cdn.ncbi.nlm.nih.gov/pmc/blobs/3c83/7508407/4bb8c40fe1be/pone.0239006.g007.jpg

相似文献

1
Estimation of potential agricultural non-point source pollution for Baiyangdian Basin, China, under different environment protection policies.不同环境保护政策下中国白洋淀流域农业面源污染的估算。
PLoS One. 2020 Sep 22;15(9):e0239006. doi: 10.1371/journal.pone.0239006. eCollection 2020.
2
[Temporal and Spatial Variation Characteristics and Source Analysis of Agricultural Non-point Source Pollution Load in Guangdong During the Past 20 Years].[近20年广东农业面源污染负荷时空变化特征及源解析]
Huan Jing Ke Xue. 2022 Jun 8;43(6):3118-3127. doi: 10.13227/j.hjkx.202108071.
3
[Spatial heterogeneity and classified control of agricultural non-point source pollution in Huaihe River Basin].[淮河流域农业面源污染的空间异质性与分类控制]
Huan Jing Ke Xue. 2013 Feb;34(2):547-54.
4
[Spatial discharge characteristics and total load control of non-point source pollutants based on the catchment scale].基于流域尺度的非点源污染物空间排放特征及总量负荷控制
Huan Jing Ke Xue. 2011 Sep;32(9):2554-61.
5
[Temporal and Spatial Evolution of Non-point Source Pollution Load of Total Nitrogen in Tuojiang River Basin].[沱江流域总氮非点源污染负荷的时空演变]
Huan Jing Ke Xue. 2021 Aug 8;42(8):3773-3784. doi: 10.13227/j.hjkx.202011120.
6
Agricultural non-point source pollution and rural transformation in a plain river network: Insights from Jiaxing city, China.平原河网地区农业面源污染与农村转型——以嘉兴市为例
Environ Pollut. 2023 Sep 15;333:121953. doi: 10.1016/j.envpol.2023.121953. Epub 2023 Jun 10.
7
Diffusion pollution from livestock and poultry rearing in the Yangtze Delta, China.中国长江三角洲地区畜禽养殖的扩散污染。
Environ Sci Pollut Res Int. 2008 May;15(3):273-7. doi: 10.1065/espr2007.07.438.
8
Assessment and analysis of agricultural non-point source pollution loads in China: 1978-2017.中国农业面源污染负荷的评估与分析:1978-2017 年。
J Environ Manage. 2020 Jun 1;263:110400. doi: 10.1016/j.jenvman.2020.110400. Epub 2020 Mar 12.
9
Source apportionment of nitrogen and phosphorus from non-point source pollution in Nansi Lake Basin, China.中国南四湖流域非点源污染氮磷来源解析。
Environ Sci Pollut Res Int. 2018 Jul;25(19):19101-19113. doi: 10.1007/s11356-018-1956-8. Epub 2018 May 3.
10
Identifying the critical areas and primary sources for agricultural non-point source pollution management of an emigrant town within the Three Gorges reservoir area.识别三峡库区移民城镇农业面源污染管理的关键领域和主要来源。
Environ Monit Assess. 2023 Apr 21;195(5):602. doi: 10.1007/s10661-023-11180-2.

引用本文的文献

1
Evolution characteristics and driving factors of potential non-point source pollution risks in a watershed affected by land use changes.土地利用变化影响下流域潜在面源污染风险的演变特征及驱动因素
Heliyon. 2024 Aug 30;10(17):e37247. doi: 10.1016/j.heliyon.2024.e37247. eCollection 2024 Sep 15.
2
Research on multiple co-governance of agricultural non-point source pollution in China on the perspective of ENGOs and public participation.中国农业面源污染多元共治的 NGO 与公众参与视角研究
PLoS One. 2023 Feb 9;18(2):e0280360. doi: 10.1371/journal.pone.0280360. eCollection 2023.
3
Decoupling agriculture pollution and carbon reduction from economic growth in the Yangtze River Delta, China.

本文引用的文献

1
Phosphorus and water budgets in an agricultural basin.农业流域的磷和水预算。
Environ Sci Technol. 2014;48(15):8481-90. doi: 10.1021/es500738v. Epub 2014 Jul 10.
2
Long-term variation (1960-2003) and causal factors of non-point-source nitrogen and phosphorus in the upper reach of the Yangtze River.长江上游地区非点源氮磷的长期变化(1960-2003)及其成因。
J Hazard Mater. 2013 May 15;252-253:45-56. doi: 10.1016/j.jhazmat.2013.02.039. Epub 2013 Mar 1.
3
Tracking nonpoint source nitrogen pollution in human-impacted watersheds.
长三角地区农业污染减排与经济增长脱钩。
PLoS One. 2023 Jan 20;18(1):e0280268. doi: 10.1371/journal.pone.0280268. eCollection 2023.
4
Spatiotemporal changes of eutrophication and heavy metal pollution in the inflow river system of Baiyangdian after the establishment of Xiongan New Area.白洋淀入流系统自雄安新区设立以来富营养化及重金属污染的时空变化。
PeerJ. 2022 May 3;10:e13400. doi: 10.7717/peerj.13400. eCollection 2022.
5
Identification of chromatin states during zebrafish gastrulation using CUT&RUN and CUT&Tag.使用 CUT&RUN 和 CUT&Tag 技术在斑马鱼原肠胚形成过程中鉴定染色质状态。
Dev Dyn. 2022 Apr;251(4):729-742. doi: 10.1002/dvdy.430. Epub 2021 Oct 23.
6
Can China's industrial policies enhance the green competitiveness of the manufacturing industry?中国的产业政策能否提升制造业的绿色竞争力?
PLoS One. 2021 Jun 30;16(6):e0253774. doi: 10.1371/journal.pone.0253774. eCollection 2021.
追踪人类活动影响流域的非点源氮污染。
Environ Sci Technol. 2011 Oct 1;45(19):8225-32. doi: 10.1021/es200779e. Epub 2011 Sep 2.
4
Current status of agricultural and rural non-point source Pollution assessment in China.中国农业和农村非点源污染评估的现状。
Environ Pollut. 2010 May;158(5):1159-68. doi: 10.1016/j.envpol.2009.10.047. Epub 2009 Nov 20.