Neyens Thomas, Faes Christel, Vranckx Maren, Pepermans Koen, Hens Niel, Van Damme Pierre, Molenberghs Geert, Aerts Jan, Beutels Philippe
I-BioStat, Data Science Institute, Hasselt University, Martelarenlaan 42, Hasselt B-3500, Belgium; I-BioStat, Department of Public Health and Primary Care, Faculty of Medicine, KU Leuven, Kapucijnenvoer 35, Leuven B-3000, Belgium.
I-BioStat, Data Science Institute, Hasselt University, Martelarenlaan 42, Hasselt B-3500, Belgium.
Spat Spatiotemporal Epidemiol. 2020 Nov;35:100379. doi: 10.1016/j.sste.2020.100379. Epub 2020 Sep 25.
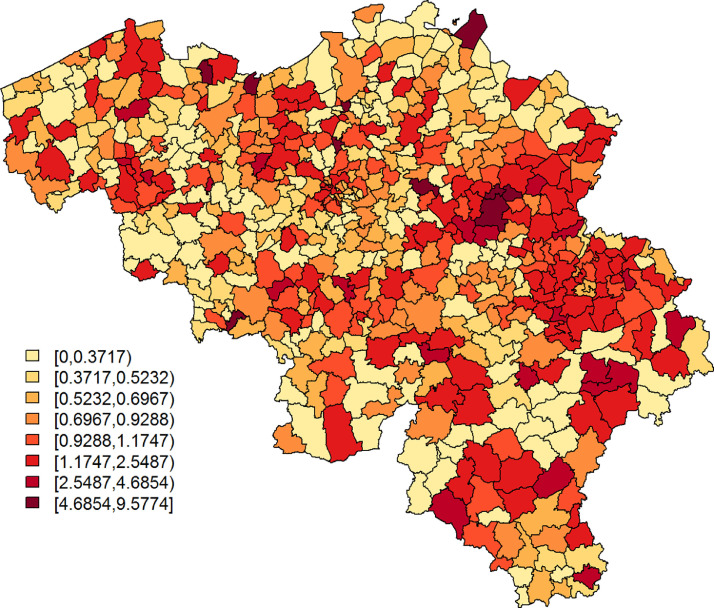
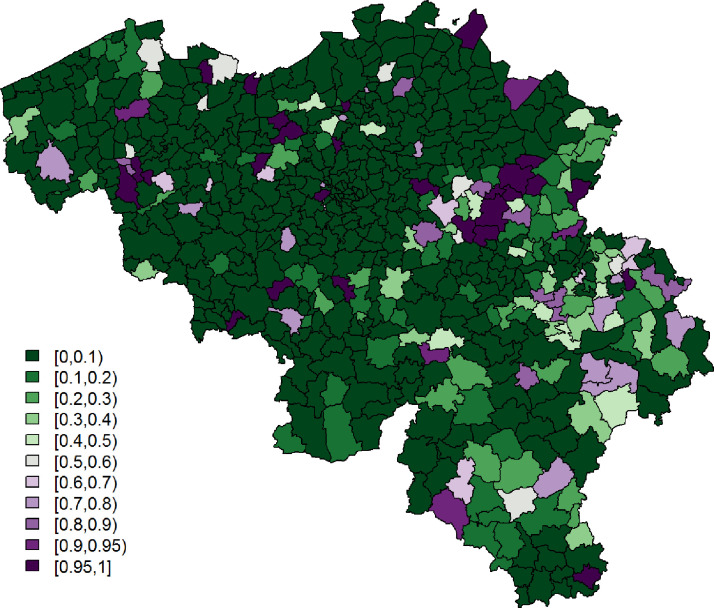
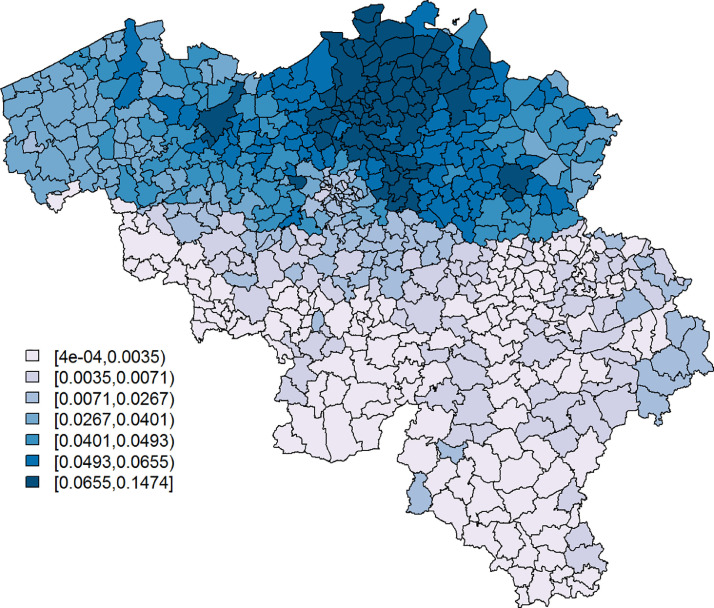
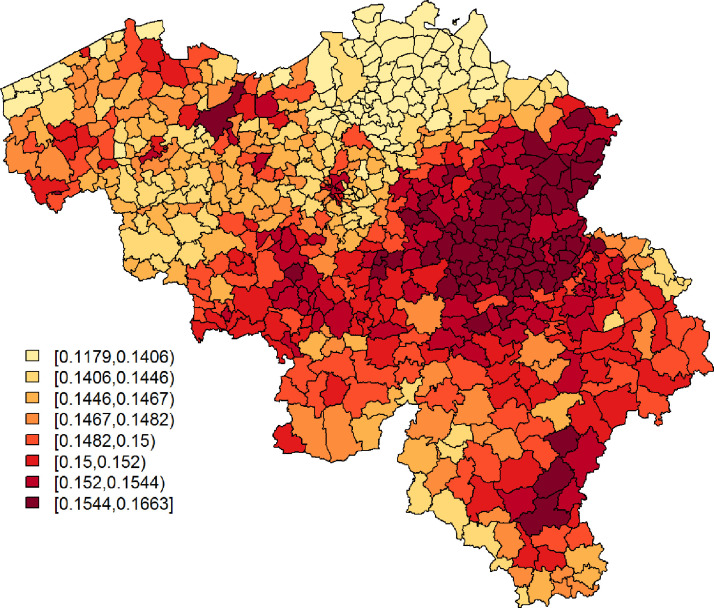
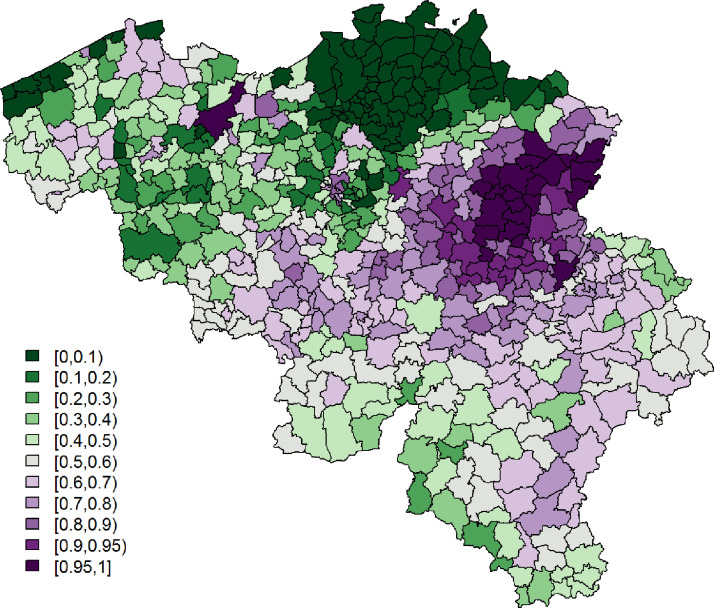
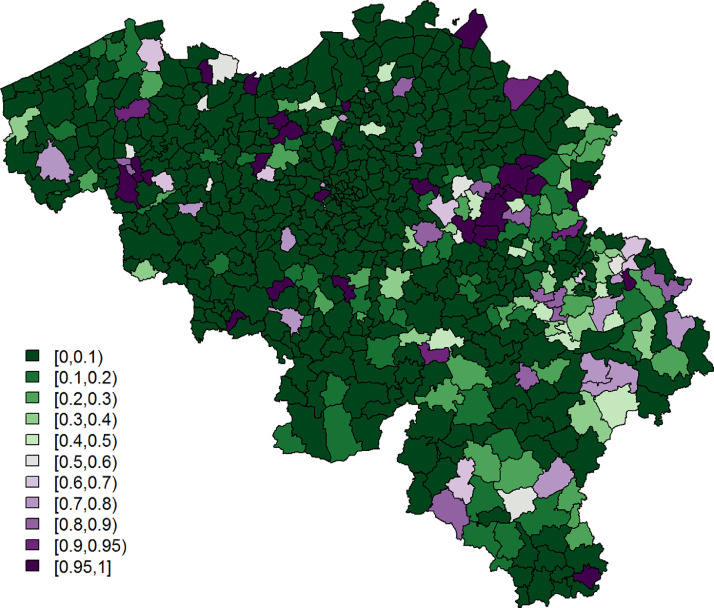
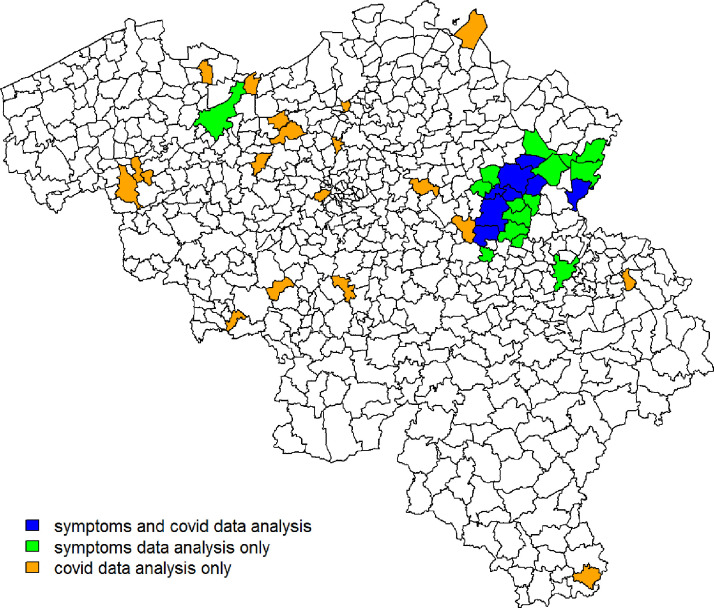
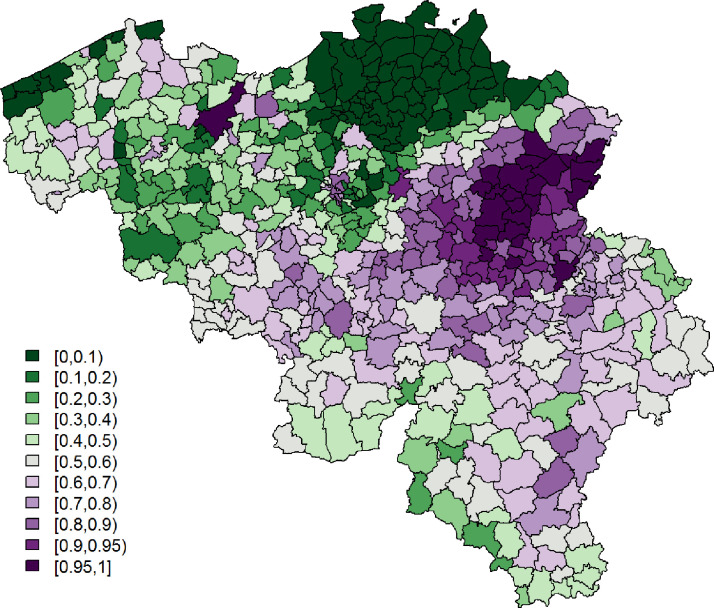
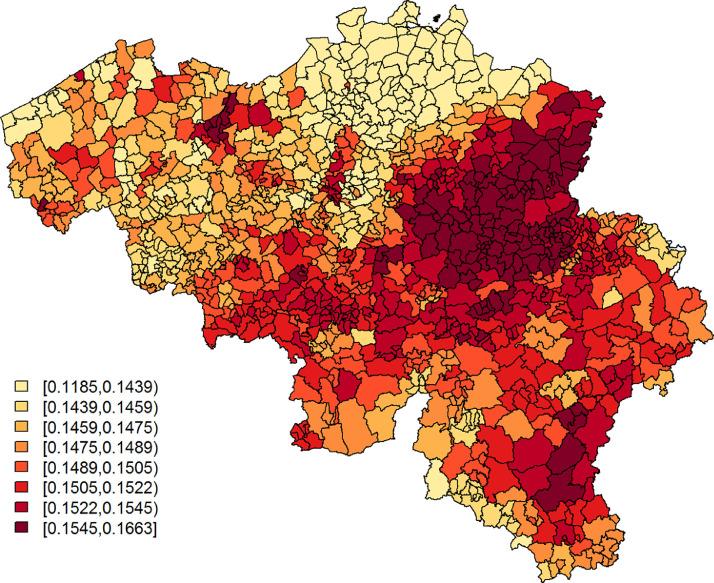
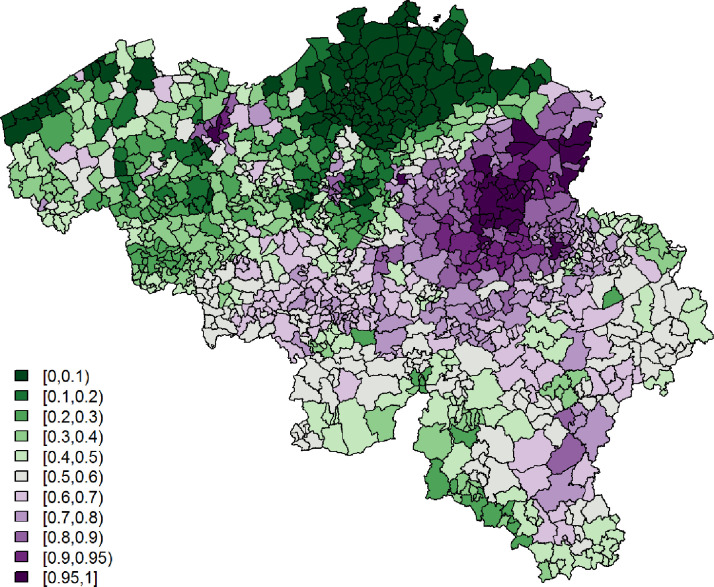
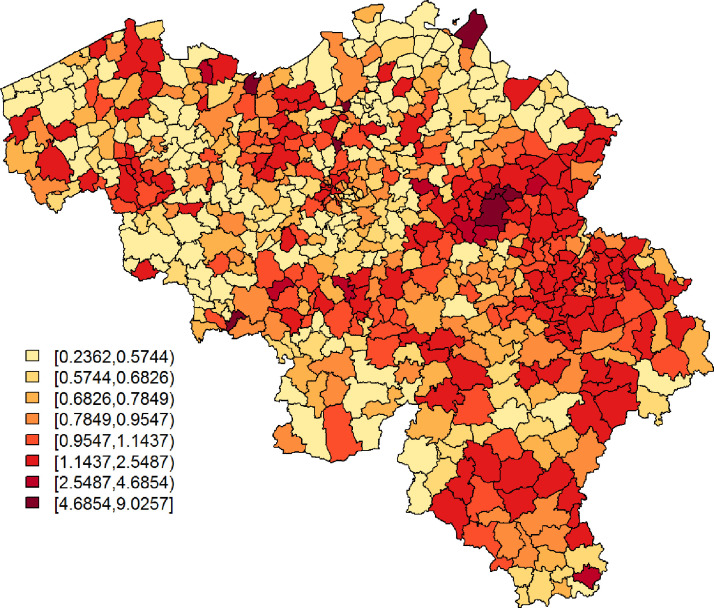
Although COVID-19 has been spreading throughout Belgium since February, 2020, its spatial dynamics in Belgium remain poorly understood, partly due to the limited testing of suspected cases during the epidemic's early phase. We analyse data of COVID-19 symptoms, as self-reported in a weekly online survey, which is open to all Belgian citizens. We predict symptoms' incidence using binomial models for spatially discrete data, and we introduce these as a covariate in the spatial analysis of COVID-19 incidence, as reported by the Belgian government during the days following a survey round. The symptoms' incidence is moderately predictive of the variation in the relative risks based on the confirmed cases; exceedance probability maps of the symptoms' incidence and confirmed cases' relative risks overlap partly. We conclude that this framework can be used to detect COVID-19 clusters of substantial sizes, but it necessitates spatial information on finer scales to locate small clusters.
尽管自2020年2月以来,新冠病毒病一直在比利时境内传播,但其在比利时的空间动态仍鲜为人知,部分原因是在疫情早期阶段,疑似病例的检测有限。我们分析了每周在线调查中自我报告的新冠病毒病症状数据,该调查对所有比利时公民开放。我们使用针对空间离散数据的二项式模型预测症状发病率,并将其作为协变量引入到新冠病毒病发病率的空间分析中,新冠病毒病发病率由比利时政府在一轮调查后的几天内报告。症状发病率对基于确诊病例的相对风险变化具有中等程度的预测性;症状发病率和确诊病例相对风险的超越概率图部分重叠。我们得出结论,该框架可用于检测规模较大的新冠病毒病聚集区,但需要更精细尺度的空间信息来定位小聚集区。