• 文献检索
  • 文档翻译
  • 深度研究
  • 学术资讯
  • Suppr Zotero 插件Zotero 插件
  • 邀请有礼
  • 套餐&价格
  • 历史记录
应用&插件
Suppr Zotero 插件Zotero 插件浏览器插件Mac 客户端Windows 客户端微信小程序
定价
高级版会员购买积分包购买API积分包
服务
文献检索文档翻译深度研究API 文档MCP 服务
关于我们
关于 Suppr公司介绍联系我们用户协议隐私条款
关注我们

Suppr 超能文献

核心技术专利:CN118964589B侵权必究
粤ICP备2023148730 号-1Suppr @ 2026

文献检索

告别复杂PubMed语法,用中文像聊天一样搜索,搜遍4000万医学文献。AI智能推荐,让科研检索更轻松。

立即免费搜索

文件翻译

保留排版,准确专业,支持PDF/Word/PPT等文件格式,支持 12+语言互译。

免费翻译文档

深度研究

AI帮你快速写综述,25分钟生成高质量综述,智能提取关键信息,辅助科研写作。

立即免费体验

流感大流行期间空间连通性的相变

Phase Transitions in Spatial Connectivity during Influenza Pandemics.

作者信息

Harding Nathan, Spinney Richard, Prokopenko Mikhail

机构信息

Centre for Complex Systems, Faculty of Engineering, The University of Sydney, Sydney, NSW 2006, Australia.

Marie Bashir Institute for Infectious Diseases and Biosecurity, University of Sydney, Westmead, NSW 2145, Australia.

出版信息

Entropy (Basel). 2020 Jan 22;22(2):133. doi: 10.3390/e22020133.

DOI:10.3390/e22020133
PMID:33285908
原文链接:https://pmc.ncbi.nlm.nih.gov/articles/PMC7516543/
Abstract

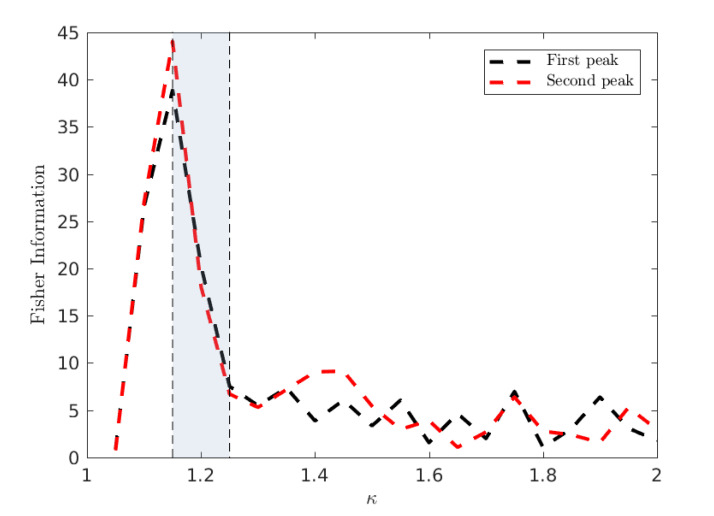
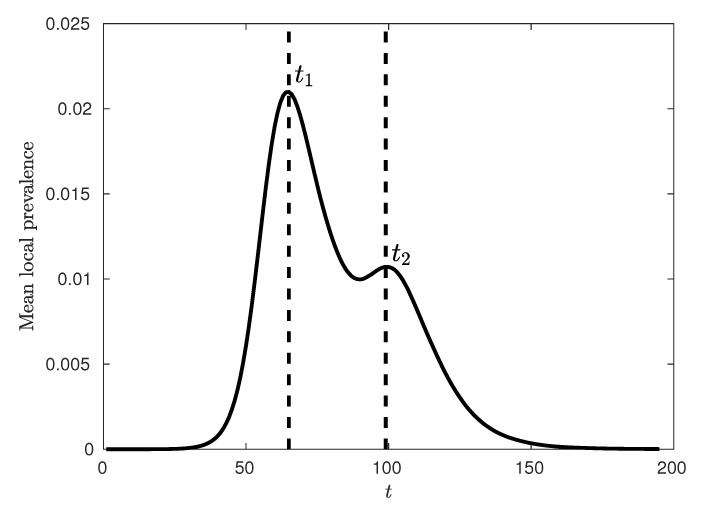
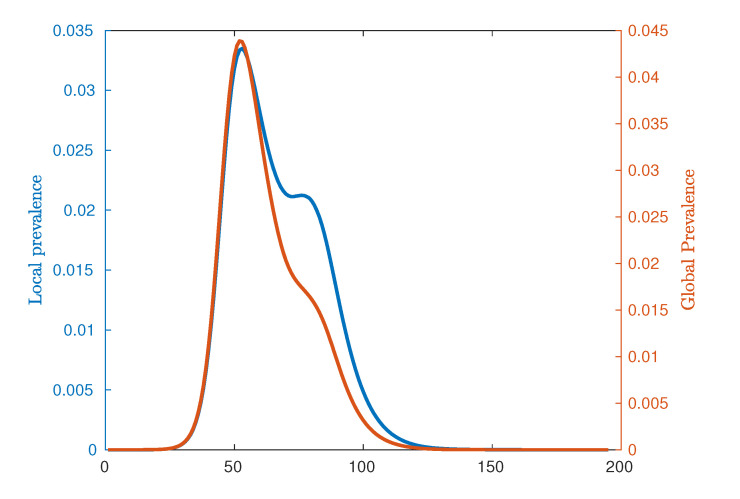
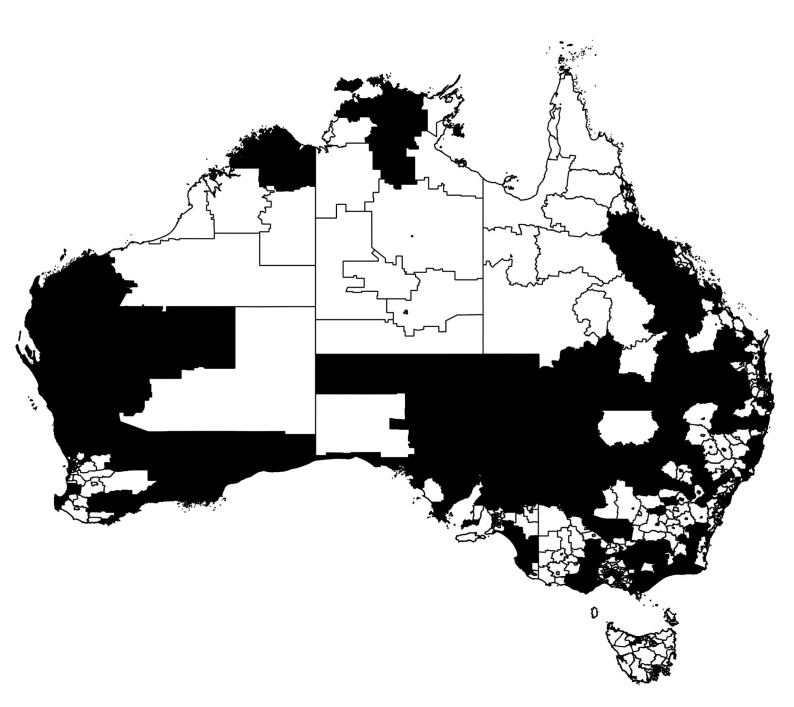
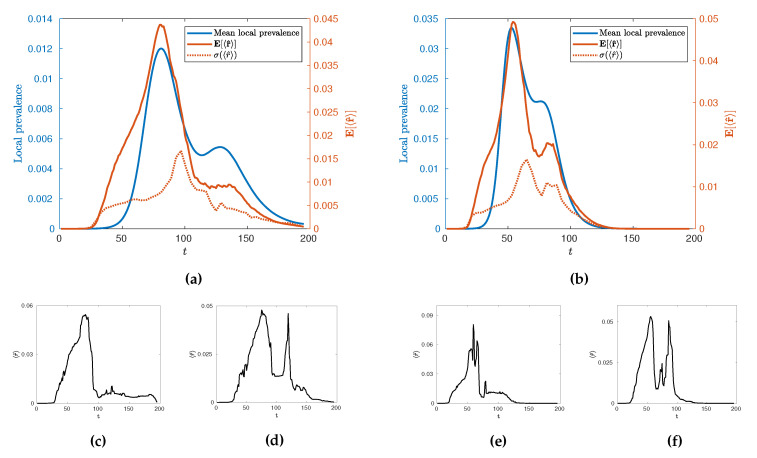
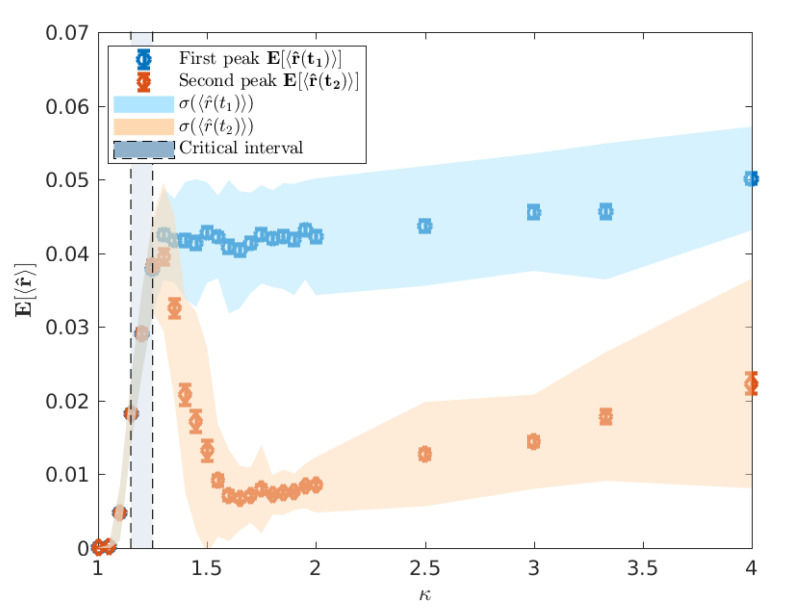
We investigated phase transitions in spatial connectivity during influenza pandemics, relating epidemic thresholds to the formation of clusters defined in terms of average infection. We employed a large-scale agent-based model of influenza spread at a national level: the Australian Census-based Epidemic Model (AceMod). In using the AceMod simulation framework, which leverages the 2016 Australian census data and generates a surrogate population of ≈23.4 million agents, we analysed the spread of simulated epidemics across geographical regions defined according to the Australian Statistical Geography Standard. We considered adjacent geographic regions with above average prevalence to be connected, and the resultant spatial connectivity was then analysed at specific time points of the epidemic. Specifically, we focused on the times when the epidemic prevalence peaks, either nationally (first wave) or at a community level (second wave). Using the percolation theory, we quantified the connectivity and identified critical regimes corresponding to abrupt changes in patterns of the spatial distribution of infection. The analysis of criticality is confirmed by computing Fisher Information in a model-independent way. The results suggest that the post-critical phase is characterised by different spatial patterns of infection developed during the first or second waves (distinguishing urban and rural epidemic peaks).

摘要

我们研究了流感大流行期间空间连通性的相变,将流行阈值与根据平均感染定义的集群形成联系起来。我们采用了一个基于主体的全国范围流感传播大规模模型:基于澳大利亚人口普查的流行病模型(AceMod)。在使用AceMod模拟框架时,该框架利用了2016年澳大利亚人口普查数据并生成了一个约2340万主体的替代人群,我们分析了模拟流行病在根据澳大利亚统计地理标准定义的地理区域中的传播情况。我们将患病率高于平均水平的相邻地理区域视为相连,然后在疫情的特定时间点分析由此产生的空间连通性。具体而言,我们关注疫情患病率达到峰值的时间,无论是在全国范围内(第一波)还是在社区层面(第二波)。使用渗流理论,我们量化了连通性,并确定了与感染空间分布模式的突然变化相对应的临界状态。通过以与模型无关的方式计算费舍尔信息,证实了对临界性的分析。结果表明,临界后阶段的特征是在第一波或第二波期间(区分城市和农村疫情峰值)形成的不同感染空间模式。

https://cdn.ncbi.nlm.nih.gov/pmc/blobs/b3c1/7516543/fe9d7642d9cf/entropy-22-00133-g011.jpg
https://cdn.ncbi.nlm.nih.gov/pmc/blobs/b3c1/7516543/ac852743d89d/entropy-22-00133-g001.jpg
https://cdn.ncbi.nlm.nih.gov/pmc/blobs/b3c1/7516543/90c56e6d69aa/entropy-22-00133-g002.jpg
https://cdn.ncbi.nlm.nih.gov/pmc/blobs/b3c1/7516543/4b0a2447e687/entropy-22-00133-g003.jpg
https://cdn.ncbi.nlm.nih.gov/pmc/blobs/b3c1/7516543/445f4ca30ae6/entropy-22-00133-g004.jpg
https://cdn.ncbi.nlm.nih.gov/pmc/blobs/b3c1/7516543/ec4614f77d81/entropy-22-00133-g005.jpg
https://cdn.ncbi.nlm.nih.gov/pmc/blobs/b3c1/7516543/2f4db720f178/entropy-22-00133-g006.jpg
https://cdn.ncbi.nlm.nih.gov/pmc/blobs/b3c1/7516543/7bce3d67c620/entropy-22-00133-g007.jpg
https://cdn.ncbi.nlm.nih.gov/pmc/blobs/b3c1/7516543/b4c667b7de46/entropy-22-00133-g008.jpg
https://cdn.ncbi.nlm.nih.gov/pmc/blobs/b3c1/7516543/f85790e87a6f/entropy-22-00133-g009.jpg
https://cdn.ncbi.nlm.nih.gov/pmc/blobs/b3c1/7516543/4e59c8cee6cc/entropy-22-00133-g010.jpg
https://cdn.ncbi.nlm.nih.gov/pmc/blobs/b3c1/7516543/fe9d7642d9cf/entropy-22-00133-g011.jpg

相似文献

1
Phase Transitions in Spatial Connectivity during Influenza Pandemics.流感大流行期间空间连通性的相变
Entropy (Basel). 2020 Jan 22;22(2):133. doi: 10.3390/e22020133.
2
Spatial characteristics and the epidemiology of human infections with avian influenza A(H7N9) virus in five waves from 2013 to 2017 in Zhejiang Province, China.2013年至2017年中国浙江省五波甲型H7N9禽流感病毒人间感染的空间特征与流行病学
PLoS One. 2017 Jul 27;12(7):e0180763. doi: 10.1371/journal.pone.0180763. eCollection 2017.
3
Rapid mapping of the spatial and temporal intensity of influenza.流感时空强度的快速测绘。
Eur J Clin Microbiol Infect Dis. 2019 Jul;38(7):1307-1312. doi: 10.1007/s10096-019-03554-7. Epub 2019 May 8.
4
Spatiotemporal evolution of COVID-19 infection and detection within night light networks: comparative analysis of USA and China.夜光网络中新冠病毒感染与检测的时空演变:美国与中国的比较分析
Appl Netw Sci. 2021;6(1):10. doi: 10.1007/s41109-020-00345-4. Epub 2021 Feb 11.
5
Geographic transmission hubs of the 2009 influenza pandemic in the United States.2009 年流感大流行在美国的地理传播中心。
Epidemics. 2019 Mar;26:86-94. doi: 10.1016/j.epidem.2018.10.002. Epub 2018 Oct 10.
6
Assessing the use of mobile phone data to describe recurrent mobility patterns in spatial epidemic models.评估在空间流行病模型中使用手机数据描述反复出现的流动模式的情况。
R Soc Open Sci. 2017 May 17;4(5):160950. doi: 10.1098/rsos.160950. eCollection 2017 May.
7
What can urban mobility data reveal about the spatial distribution of infection in a single city?城市流动数据如何揭示单城市感染的空间分布?
BMC Public Health. 2019 May 29;19(1):656. doi: 10.1186/s12889-019-6968-x.
8
Characteristics of geographical spread and temporal accumulation of the 2009 influenza A (H1N1) epidemic in Japan Based on National Surveillance Data.基于国家监测数据的2009年日本甲型H1N1流感疫情的地理传播特征及时间累积情况
Jpn J Infect Dis. 2014;67(5):368-73. doi: 10.7883/yoken.67.368.
9
Epidemic Wave Dynamics Attributable to Urban Community Structure: A Theoretical Characterization of Disease Transmission in a Large Network.城市社区结构引发的疫情波动态:大型网络中疾病传播的理论表征
J Med Internet Res. 2015 Jul 8;17(7):e169. doi: 10.2196/jmir.3720.
10
[Spatial and temporal spread predictability of influenza A H1N1 epidemic in Argentina by the percolation method].[采用渗流方法对阿根廷甲型H1N1流感疫情的时空传播可预测性]
Rev Argent Microbiol. 2011 Jul-Sep;43(3):186-90. doi: 10.1590/S0325-75412011000300005.

引用本文的文献

1
A semi-empirical risk panel to monitor epidemics: multi-faceted tool to assist healthcare and public health professionals.用于监测传染病的半经验风险面板:协助医疗保健和公共卫生专业人员的多方面工具。
Front Public Health. 2024 Jan 8;11:1307425. doi: 10.3389/fpubh.2023.1307425. eCollection 2023.
2
Data-driven methods for present and future pandemics: Monitoring, modelling and managing.针对当前及未来大流行疾病的数据驱动方法:监测、建模与管理。
Annu Rev Control. 2021;52:448-464. doi: 10.1016/j.arcontrol.2021.05.003. Epub 2021 Jun 29.
3
Safety and Health Measures for COVID-19 Transition Period in the Hotel Industry in Spain.

本文引用的文献

1
Population mobility induced phase separation in SIS epidemic and social dynamics.人口流动诱导 SIS 传染病和社会动态的相变。
Sci Rep. 2020 May 6;10(1):7646. doi: 10.1038/s41598-020-64183-1.
2
Creating a surrogate commuter network from Australian Bureau of Statistics census data.利用澳大利亚统计局的人口普查数据创建一个替代通勤者网络。
Sci Data. 2019 Aug 16;6(1):150. doi: 10.1038/s41597-019-0137-z.
3
The Effects of Imitation Dynamics on Vaccination Behaviours in SIR-Network Model.模仿动力学对 SIR 网络模型中疫苗接种行为的影响。
西班牙酒店业 COVID-19 过渡期的安全和健康措施。
Int J Environ Res Public Health. 2021 Jan 15;18(2):718. doi: 10.3390/ijerph18020718.
4
Modelling transmission and control of the COVID-19 pandemic in Australia.模拟澳大利亚 COVID-19 大流行的传播和控制。
Nat Commun. 2020 Nov 11;11(1):5710. doi: 10.1038/s41467-020-19393-6.
5
Population mobility induced phase separation in SIS epidemic and social dynamics.人口流动诱导 SIS 传染病和社会动态的相变。
Sci Rep. 2020 May 6;10(1):7646. doi: 10.1038/s41598-020-64183-1.
6
Interfering with influenza: nonlinear coupling of reactive and static mitigation strategies.干预流感:反应性和静态缓解策略的非线性耦合
J R Soc Interface. 2020 Apr;17(165):20190728. doi: 10.1098/rsif.2019.0728. Epub 2020 Apr 22.
Int J Environ Res Public Health. 2019 Jul 11;16(14):2477. doi: 10.3390/ijerph16142477.
4
Network properties of salmonella epidemics.沙门氏菌病疫情的网络特性。
Sci Rep. 2019 Apr 16;9(1):6159. doi: 10.1038/s41598-019-42582-3.
5
Improving emergency preparedness and response in the Asia-Pacific.加强亚太地区的应急准备与响应能力。
BMJ Glob Health. 2019 Jan 29;4(1):e001271. doi: 10.1136/bmjgh-2018-001271. eCollection 2019.
6
Urbanization affects peak timing, prevalence, and bimodality of influenza pandemics in Australia: Results of a census-calibrated model.城市化对澳大利亚流感大流行的峰值时间、流行率和双峰模式的影响:经过人口普查校准的模型结果。
Sci Adv. 2018 Dec 12;4(12):eaau5294. doi: 10.1126/sciadv.aau5294. eCollection 2018 Dec.
7
On critical dynamics and thermodynamic efficiency of urban transformations.论城市转型的临界动力学与热力学效率
R Soc Open Sci. 2018 Oct 17;5(10):180863. doi: 10.1098/rsos.180863. eCollection 2018 Oct.
8
Thermodynamic efficiency of contagions: a statistical mechanical analysis of the SIS epidemic model.传染病的热力学效率:SIS 流行病模型的统计力学分析
Interface Focus. 2018 Dec 6;8(6):20180036. doi: 10.1098/rsfs.2018.0036. Epub 2018 Oct 19.
9
Fisher information and criticality in the Kuramoto model of nonidentical oscillators.非同源振荡器的 Kuramoto 模型中的 Fisher 信息和临界点。
Phys Rev E. 2018 Aug;98(2-1):022302. doi: 10.1103/PhysRevE.98.022302.
10
Forecasting the spatial transmission of influenza in the United States.预测美国流感的空间传播。
Proc Natl Acad Sci U S A. 2018 Mar 13;115(11):2752-2757. doi: 10.1073/pnas.1708856115. Epub 2018 Feb 26.