• 文献检索
  • 文档翻译
  • 深度研究
  • 学术资讯
  • Suppr Zotero 插件Zotero 插件
  • 邀请有礼
  • 套餐&价格
  • 历史记录
应用&插件
Suppr Zotero 插件Zotero 插件浏览器插件Mac 客户端Windows 客户端微信小程序
定价
高级版会员购买积分包购买API积分包
服务
文献检索文档翻译深度研究API 文档MCP 服务
关于我们
关于 Suppr公司介绍联系我们用户协议隐私条款
关注我们

Suppr 超能文献

核心技术专利:CN118964589B侵权必究
粤ICP备2023148730 号-1Suppr @ 2026

文献检索

告别复杂PubMed语法,用中文像聊天一样搜索,搜遍4000万医学文献。AI智能推荐,让科研检索更轻松。

立即免费搜索

文件翻译

保留排版,准确专业,支持PDF/Word/PPT等文件格式,支持 12+语言互译。

免费翻译文档

深度研究

AI帮你快速写综述,25分钟生成高质量综述,智能提取关键信息,辅助科研写作。

立即免费体验

利用时变 SIR 回归模型估计未报告的 COVID-19 病例。

Estimating Unreported COVID-19 Cases with a Time-Varying SIR Regression Model.

机构信息

Department of Graphics and Digital Technology, School of Urban Design, Wuhan University, Wuhan 430072, China.

Department of Urban Planning, School of Urban Design, Wuhan University, Wuhan 430072, China.

出版信息

Int J Environ Res Public Health. 2021 Jan 26;18(3):1090. doi: 10.3390/ijerph18031090.

DOI:10.3390/ijerph18031090
PMID:33530563
原文链接:https://pmc.ncbi.nlm.nih.gov/articles/PMC7908085/
Abstract

BACKGROUND

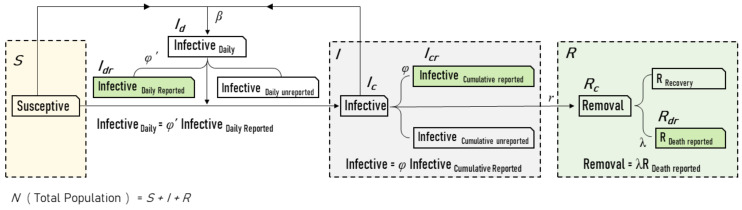
Potential unreported infection might impair and mislead policymaking for COVID-19, and the contemporary spread of COVID-19 varies in different counties of the United States. It is necessary to estimate the cases that might be underestimated based on county-level data, to take better countermeasures against COVID-19. We suggested taking time-varying Susceptible-Infected-Recovered (SIR) models with unreported infection rates (UIR) to estimate factual COVID-19 cases in the United States.

METHODS

Both the SIR model integrated with unreported infection rates (SIRu) of fixed-time effect and SIRu with time-varying parameters (tvSIRu) were applied to estimate and compare the values of transmission rate (TR), UIR, and infection fatality rate (IFR) based on US county-level COVID-19 data.

RESULTS

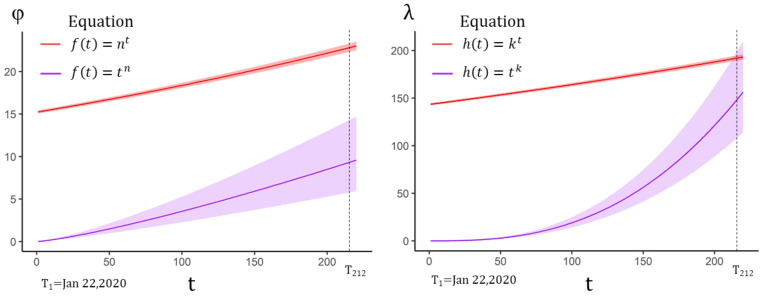
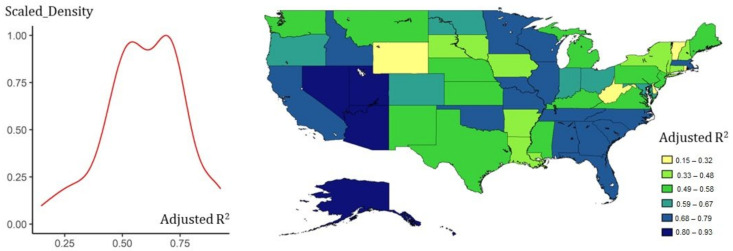
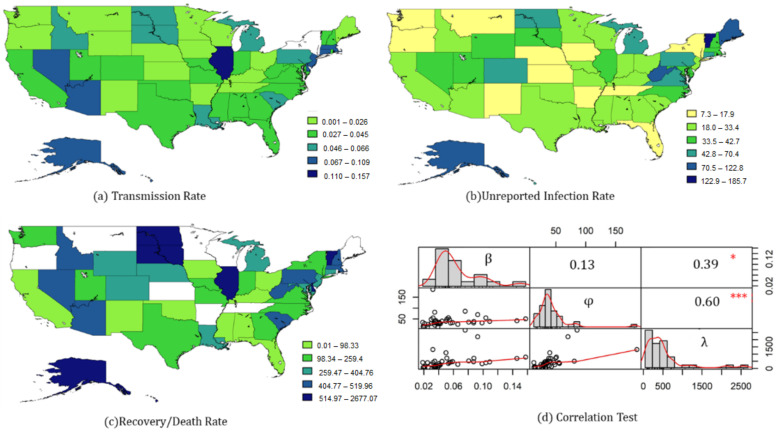
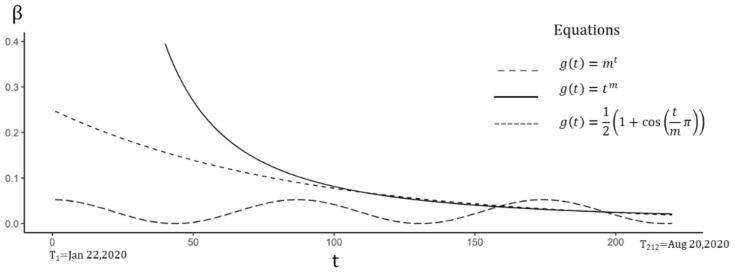
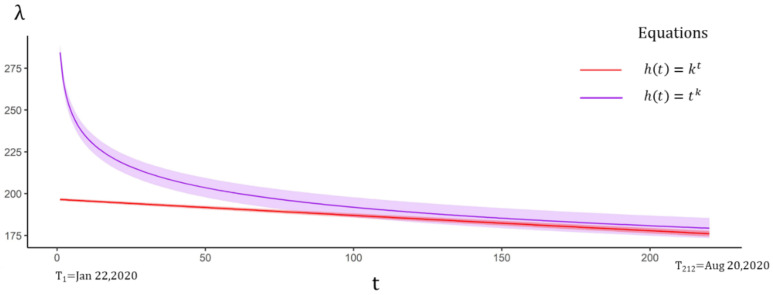
Based on the US county-level COVID-19 data from 22 January (T) to 20 August (T) in 2020, SIRu was first tested and verified by Ordinary Least Squares (OLS) regression. Further regression of SIRu at the county-level showed that the average values of TR, UIR, and IFR were 0.034%, 19.5%, and 0.51% respectively. The ranges of TR, UIR, and IFR for all states ranged from 0.007-0.157 (mean = 0.048), 7.31-185.6 (mean = 38.89), and 0.04-2.22% (mean = 0.22%). Among the time-varying TR equations, the power function showed better fitness, which indicated a decline in TR decreasing from 227.58 (T) to 0.022 (T). The general equation of tvSIRu showed that both the UIR and IFR were gradually increasing, wherein, the estimated value of UIR was 9.1 (95%CI 5.7-14.0) and IFR was 0.70% (95%CI 0.52-0.95%) at T.

INTERPRETATION

Despite the declining trend in TR and IFR, the UIR of COVID-19 in the United States is still on the rise, which, it was assumed would decrease with sufficient tests or improved countersues. The US medical system might be largely affected by severe cases amidst a rapid spread of COVID-19.

摘要

背景

潜在的未报告感染可能会影响和误导 COVID-19 的决策制定,而 COVID-19 在不同的美国县的传播情况也不同。有必要根据县级数据来估计可能被低估的病例,以便更好地应对 COVID-19。我们建议采用带有未报告感染率(UIR)的时变易感-感染-恢复(SIR)模型来估计美国的实际 COVID-19 病例。

方法

我们应用固定时间效应的 SIR 模型与具有时变参数的 SIRu(tvSIRu)来估计和比较基于美国县级 COVID-19 数据的传播率(TR)、UIR 和感染致死率(IFR)的值。

结果

根据美国 2020 年 1 月 22 日(T)至 8 月 20 日(T)期间的县级 COVID-19 数据,我们首先通过最小二乘法(OLS)回归测试和验证了 SIRu。进一步对县级 SIRu 的回归显示,TR、UIR 和 IFR 的平均值分别为 0.034%、19.5%和 0.51%。所有州的 TR、UIR 和 IFR 范围从 0.007-0.157(均值=0.048)、7.31-185.6(均值=38.89)和 0.04-2.22%(均值=0.22%)。在时变 TR 方程中,幂函数显示出更好的拟合度,表明 TR 从 227.58(T)下降到 0.022(T)。tvSIRu 的通用方程表明,UIR 和 IFR 都在逐渐增加,其中 UIR 的估计值为 9.1(95%CI 5.7-14.0),IFR 为 0.70%(95%CI 0.52-0.95%)在 T 时。

解释

尽管 TR 和 IFR 呈下降趋势,但美国 COVID-19 的 UIR 仍在上升,据假设,随着检测的增加或应对措施的改善,UIR 会下降。美国医疗系统可能会受到 COVID-19 快速传播带来的严重病例的严重影响。

https://cdn.ncbi.nlm.nih.gov/pmc/blobs/7c6e/7908085/c924fc96ae42/ijerph-18-01090-g006.jpg
https://cdn.ncbi.nlm.nih.gov/pmc/blobs/7c6e/7908085/f28576272745/ijerph-18-01090-g001.jpg
https://cdn.ncbi.nlm.nih.gov/pmc/blobs/7c6e/7908085/0d2310cb369d/ijerph-18-01090-g002.jpg
https://cdn.ncbi.nlm.nih.gov/pmc/blobs/7c6e/7908085/e3d0afd363af/ijerph-18-01090-g003.jpg
https://cdn.ncbi.nlm.nih.gov/pmc/blobs/7c6e/7908085/b25e823ed595/ijerph-18-01090-g004.jpg
https://cdn.ncbi.nlm.nih.gov/pmc/blobs/7c6e/7908085/12a14586f352/ijerph-18-01090-g005.jpg
https://cdn.ncbi.nlm.nih.gov/pmc/blobs/7c6e/7908085/c924fc96ae42/ijerph-18-01090-g006.jpg

相似文献

1
Estimating Unreported COVID-19 Cases with a Time-Varying SIR Regression Model.利用时变 SIR 回归模型估计未报告的 COVID-19 病例。
Int J Environ Res Public Health. 2021 Jan 26;18(3):1090. doi: 10.3390/ijerph18031090.
2
Estimating The Infection Fatality Rate Among Symptomatic COVID-19 Cases In The United States.估计美国有症状的 COVID-19 病例中的感染病死率。
Health Aff (Millwood). 2020 Jul;39(7):1229-1236. doi: 10.1377/hlthaff.2020.00455. Epub 2020 May 7.
3
Variation in the COVID-19 infection-fatality ratio by age, time, and geography during the pre-vaccine era: a systematic analysis.在疫苗接种前时代,按年龄、时间和地理位置划分的 COVID-19 感染病死率变化:系统分析。
Lancet. 2022 Apr 16;399(10334):1469-1488. doi: 10.1016/S0140-6736(21)02867-1. Epub 2022 Feb 24.
4
Estimation of COVID-19 risk-stratified epidemiological parameters and policy implications for Los Angeles County through an integrated risk and stochastic epidemiological model.通过综合风险与随机流行病学模型对洛杉矶县新冠病毒病风险分层的流行病学参数进行估计及政策影响分析
medRxiv. 2020 Dec 14:2020.12.11.20209627. doi: 10.1101/2020.12.11.20209627.
5
Dynamic Panel Surveillance of COVID-19 Transmission in the United States to Inform Health Policy: Observational Statistical Study.美国新冠病毒传播的动态面板监测以指导卫生政策:观察性统计研究
J Med Internet Res. 2020 Oct 5;22(10):e21955. doi: 10.2196/21955.
6
[Infection fatality rate (IFR) during the course of COVID-19 pandemic in Upper Silesia Metropolitan Area (Poland) in 2020].[2020年波兰上西里西亚都会区新冠疫情期间的感染死亡率(IFR)]
Med Pr. 2021 Dec 22;72(6):671-676. doi: 10.13075/mp.5893.01179. Epub 2021 Nov 9.
7
A Simulation of a COVID-19 Epidemic Based on a Deterministic SEIR Model.基于确定性 SEIR 模型的 COVID-19 疫情模拟。
Front Public Health. 2020 May 28;8:230. doi: 10.3389/fpubh.2020.00230. eCollection 2020.
8
Using Early Data to Estimate the Actual Infection Fatality Ratio from COVID-19 in France.利用早期数据估算法国新冠病毒的实际感染致死率
Biology (Basel). 2020 May 8;9(5):97. doi: 10.3390/biology9050097.
9
Modeling and tracking Covid-19 cases using Big Data analytics on HPCC system platformm.在惠普高性能计算集群(HPCC)系统平台上使用大数据分析对新冠病毒疾病(Covid-19)病例进行建模和追踪。
J Big Data. 2021;8(1):33. doi: 10.1186/s40537-021-00423-z. Epub 2021 Feb 15.
10
Multilevel modeling of county-level excessive alcohol use, rurality, and COVID-19 case fatality rates in the US.对美国县级过度饮酒、农村地区和 COVID-19 病死率的多层次建模。
PLoS One. 2021 Jun 17;16(6):e0253466. doi: 10.1371/journal.pone.0253466. eCollection 2021.

引用本文的文献

1
A simplicial epidemic model for COVID-19 spread analysis.用于 COVID-19 传播分析的单纯形传染病模型。
Proc Natl Acad Sci U S A. 2024 Jan 2;121(1):e2313171120. doi: 10.1073/pnas.2313171120. Epub 2023 Dec 26.
2
Long COVID: Is there a kidney link?长期新冠:与肾脏有关联吗?
Front Med (Lausanne). 2023 Apr 3;10:1138644. doi: 10.3389/fmed.2023.1138644. eCollection 2023.
3
Mathematical modeling to study the impact of immigration on the dynamics of the COVID-19 pandemic: A case study for Venezuela.运用数学模型研究移民对 COVID-19 大流行动态的影响:以委内瑞拉为例。

本文引用的文献

1
Building an Open Resources Repository for COVID-19 Research.构建一个用于新冠病毒研究的开放资源库。
Data Inf Manag. 2020 Sep 1;4(3):130-147. doi: 10.2478/dim-2020-0012. Epub 2022 Mar 31.
2
Dynamic model to predict the association between air quality, COVID-19 cases, and level of lockdown.动态模型预测空气质量、COVID-19 病例与封锁级别之间的关联。
Environ Pollut. 2021 Jan 1;268(Pt B):115920. doi: 10.1016/j.envpol.2020.115920. Epub 2020 Oct 29.
3
A systematic review and meta-analysis of published research data on COVID-19 infection fatality rates.
Spat Spatiotemporal Epidemiol. 2022 Nov;43:100532. doi: 10.1016/j.sste.2022.100532. Epub 2022 Aug 28.
4
A novel CO-based demand-controlled ventilation strategy to limit the spread of COVID-19 in the indoor environment.一种基于一氧化碳的需求控制通风策略,用于限制新冠病毒在室内环境中的传播。
Build Environ. 2022 Jul 1;219:109232. doi: 10.1016/j.buildenv.2022.109232. Epub 2022 May 26.
5
An Epidemiological Study to Investigate Links between Atmospheric Pollution from Farming and SARS-CoV-2 Mortality.一项针对农业大气污染与 SARS-CoV-2 死亡率之间关联的流行病学研究。
Int J Environ Res Public Health. 2022 Apr 12;19(8):4637. doi: 10.3390/ijerph19084637.
6
Gauging the Impact of Artificial Intelligence and Mathematical Modeling in Response to the COVID-19 Pandemic: A Systematic Review.评估人工智能和数学建模在应对 COVID-19 大流行中的影响:系统评价。
Biomed Res Int. 2022 Mar 14;2022:7731618. doi: 10.1155/2022/7731618. eCollection 2022.
7
The Impact of COVID-19 on Mortality in Italy: Retrospective Analysis of Epidemiological Trends.《COVID-19 对意大利死亡率的影响:流行病学趋势的回顾性分析》
JMIR Public Health Surveill. 2022 Apr 7;8(4):e36022. doi: 10.2196/36022.
对已发表的关于 COVID-19 感染病死率的研究数据的系统回顾和荟萃分析。
Int J Infect Dis. 2020 Dec;101:138-148. doi: 10.1016/j.ijid.2020.09.1464. Epub 2020 Sep 29.
4
Substantial underestimation of SARS-CoV-2 infection in the United States.美国对 SARS-CoV-2 感染的严重低估。
Nat Commun. 2020 Sep 9;11(1):4507. doi: 10.1038/s41467-020-18272-4.
5
Examining the association between socio-demographic composition and COVID-19 fatalities in the European region using spatial regression approach.使用空间回归方法研究欧洲地区社会人口构成与新冠病毒病死亡病例之间的关联。
Sustain Cities Soc. 2020 Nov;62:102418. doi: 10.1016/j.scs.2020.102418. Epub 2020 Aug 1.
6
Analysis of COVID-19 under-reporting in Brazil.巴西新冠肺炎漏报情况分析。
Rev Bras Ter Intensiva. 2020 Jun;32(2):224-228. doi: 10.5935/0103-507x.20200030. Epub 2020 Jun 24.
7
Mortality and survival of COVID-19.COVID-19 的死亡率和生存率。
Epidemiol Infect. 2020 Jun 25;148:e123. doi: 10.1017/S0950268820001405.
8
Temporal estimates of case-fatality rate for COVID-19 outbreaks in Canada and the United States.加拿大和美国 COVID-19 疫情的病死率时间估算。
CMAJ. 2020 Jun 22;192(25):E666-E670. doi: 10.1503/cmaj.200711. Epub 2020 May 22.
9
Nosocomial outbreak of COVID-19 pneumonia in Wuhan, China.中国武汉发生的 COVID-19 肺炎医院感染暴发。
Eur Respir J. 2020 Jun 4;55(6). doi: 10.1183/13993003.00544-2020. Print 2020 Jun.
10
A COVID-19 epidemic model with latency period.一种具有潜伏期的新冠疫情模型。
Infect Dis Model. 2020 Apr 28;5:323-337. doi: 10.1016/j.idm.2020.03.003. eCollection 2020.