Tiraset Nanida, Poonyathalang Anuchit, Padungkiatsagul Tanyatuth, Deeyai Montakarn, Vichitkunakorn Polathep, Vanikieti Kavin
Department of Ophthalmology, Faculty of Medicine Ramathibodi Hospital, Mahidol University, Bangkok, Thailand.
Department of Family and Preventive Medicine, Faculty of Medicine, Prince of Songkla University, Songkhla, Thailand.
Clin Ophthalmol. 2021 Feb 26;15:859-869. doi: 10.2147/OPTH.S304272. eCollection 2021.
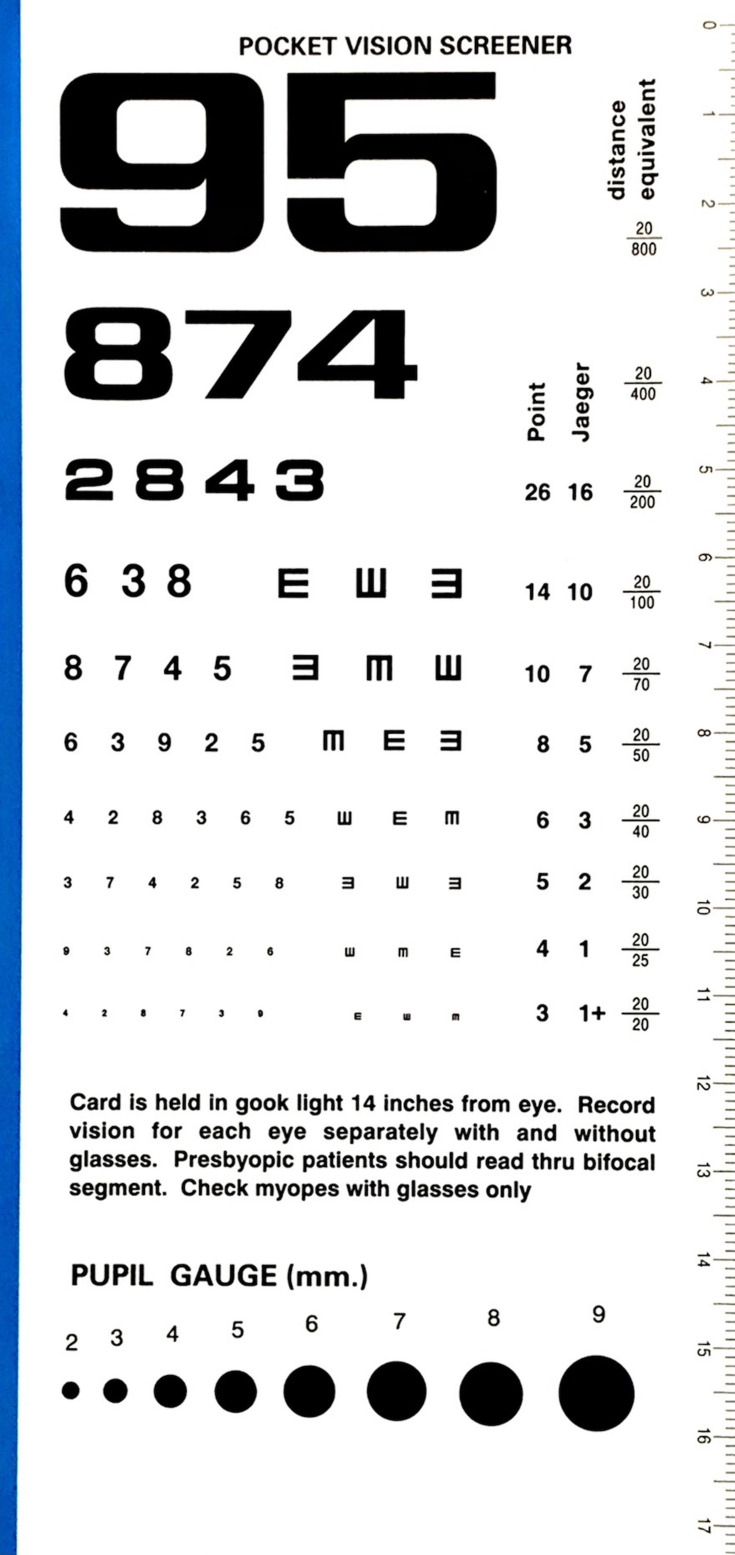
To validate the Rosenbaum near vision card (Near Chart) and a smartphone-based visual acuity (VA) test (Eye Chart) against a standard retro-illuminated Early Treatment Diabetic Retinopathy Study (ETDRS) chart within participants.
A cross-sectional study of participants aged ≥18 years was conducted. VA was measured in all participants using the ETDRS chart, Near Chart and smartphone-based Eye Chart application, respectively. VA was converted to logarithm of the minimum angle of resolution (logMAR) for statistical analysis. Eyes with ETDRS VA worse than 1.0 logMAR (20/200) were excluded. The main outcome measures were levels of agreement between VA measured using the Near Chart or Eye Chart application vs the ETDRS chart.
A total of 295 eyes of 151 participants were included. One hundred participants (66.2%) were female and the mean age was 64.3 ± 12.5 years. Educational level was high school or below for 49% of participants and at Bachelor's degree or above for 51%. The median logMAR VAs of all eyes tested using the ETDRS chart, Near Chart and Eye Chart application were 0.1, 0.0 and 0.1, respectively. The median VA difference between the Near Chart vs ETDRS chart and Eye Chart application vs ETDRS chart was 0.0 logMAR in both cases for both the right eye (OD) and left eye (OS). Intraclass correlation coefficient (ICC) demonstrated a strong positive correlation between VA tested with the Near Chart vs ETDRS chart (OD: ICC=0.85; <0.001, OS: ICC=0.77; <0.001) and Eye Chart application vs ETDRS chart (OD: ICC=0.88; <0.001, OS: ICC=0.74; <0.001).
VA measurements with the Near Chart and smartphone-based Eye Chart application corresponded well to the standard ETDRS chart, suggesting potential utility of alternative portable VA tests for in-office or remote vision monitoring, particularly during periods of physical distancing such as the Coronavirus disease 2019 (COVID-19) era.
在参与者中,将罗森鲍姆近视力表(近视力表)和基于智能手机的视力(VA)测试(电子视力表)与标准的逆向照明早期治疗糖尿病性视网膜病变研究(ETDRS)视力表进行验证对比。
对年龄≥18岁的参与者进行了一项横断面研究。分别使用ETDRS视力表、近视力表和基于智能手机的电子视力表应用程序对所有参与者进行视力测量。将视力转换为最小分辨角对数(logMAR)用于统计分析。排除ETDRS视力低于1.0 logMAR(20/200)的眼睛。主要观察指标是使用近视力表或电子视力表应用程序测量的视力与ETDRS视力表之间的一致性水平。
共纳入151名参与者的295只眼睛。100名参与者(66.2%)为女性,平均年龄为64.3±12.5岁。49%的参与者教育水平为高中或以下,51%为本科及以上。使用ETDRS视力表、近视力表和电子视力表应用程序测试的所有眼睛的logMAR视力中位数分别为0.1、0.0和0.1。右眼(OD)和左眼(OS)在近视力表与ETDRS视力表以及电子视力表应用程序与ETDRS视力表之间的视力中位数差异均为0.0 logMAR。组内相关系数(ICC)显示,近视力表与ETDRS视力表测试的视力之间存在强正相关(OD:ICC = 0.85;<0.001,OS:ICC = 0.77;<0.001),电子视力表应用程序与ETDRS视力表测试的视力之间也存在强正相关(OD:ICC = 0.88;<0.001,OS:ICC = 0.74;<0.001)。
使用近视力表和基于智能手机的电子视力表应用程序测量的视力与标准的ETDRS视力表高度相符,这表明替代便携式视力测试在办公室或远程视力监测中具有潜在用途,特别是在诸如2019冠状病毒病(COVID - 19)大流行期间的社交距离时期。