• 文献检索
  • 文档翻译
  • 深度研究
  • 学术资讯
  • Suppr Zotero 插件Zotero 插件
  • 邀请有礼
  • 套餐&价格
  • 历史记录
应用&插件
Suppr Zotero 插件Zotero 插件浏览器插件Mac 客户端Windows 客户端微信小程序
定价
高级版会员购买积分包购买API积分包
服务
文献检索文档翻译深度研究API 文档MCP 服务
关于我们
关于 Suppr公司介绍联系我们用户协议隐私条款
关注我们

Suppr 超能文献

核心技术专利:CN118964589B侵权必究
粤ICP备2023148730 号-1Suppr @ 2026

文献检索

告别复杂PubMed语法,用中文像聊天一样搜索,搜遍4000万医学文献。AI智能推荐,让科研检索更轻松。

立即免费搜索

文件翻译

保留排版,准确专业,支持PDF/Word/PPT等文件格式,支持 12+语言互译。

免费翻译文档

深度研究

AI帮你快速写综述,25分钟生成高质量综述,智能提取关键信息,辅助科研写作。

立即免费体验

美国社会脆弱性与 COVID-19 发病率和死亡率的时空趋势。

Spatial and temporal trends in social vulnerability and COVID-19 incidence and death rates in the United States.

机构信息

Division of Biostatistics, Department of Public Health Sciences, Medical University of South Carolina, Charleston, South Carolina, United States of America.

Charleston Health Equity and Rural Outreach Innovation Center (HEROIC), Ralph H. Johnson VA Medical Center, Charleston, South Carolina, United States of America.

出版信息

PLoS One. 2021 Mar 24;16(3):e0248702. doi: 10.1371/journal.pone.0248702. eCollection 2021.

DOI:10.1371/journal.pone.0248702
PMID:33760849
原文链接:https://pmc.ncbi.nlm.nih.gov/articles/PMC7990180/
Abstract

BACKGROUND

Socially vulnerable communities may be at higher risk for COVID-19 outbreaks in the US. However, no prior studies examined temporal trends and differential effects of social vulnerability on COVID-19 incidence and death rates. Therefore, we examined temporal trends among counties with high and low social vulnerability to quantify disparities in trends over time.

METHODS

We conducted a longitudinal analysis examining COVID-19 incidence and death rates from March 15 to December 31, 2020, for each US county using data from USAFacts. We classified counties using the Social Vulnerability Index (SVI), a percentile-based measure from the Centers for Disease Control and Prevention, with higher values indicating more vulnerability. Using a Bayesian hierarchical negative binomial model, we estimated daily risk ratios (RRs) comparing counties in the first (lower) and fourth (upper) SVI quartiles, adjusting for rurality, percentage in poor or fair health, percentage female, percentage of smokers, county average daily fine particulate matter (PM2.5), percentage of primary care physicians per 100,000 residents, daily temperature and precipitation, and proportion tested for COVID-19.

RESULTS

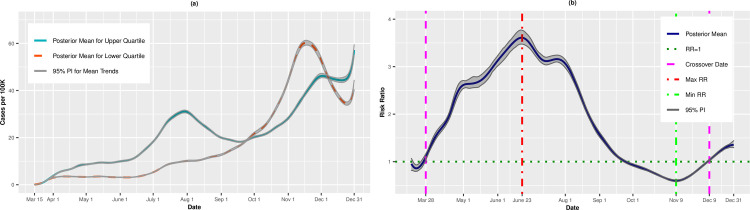
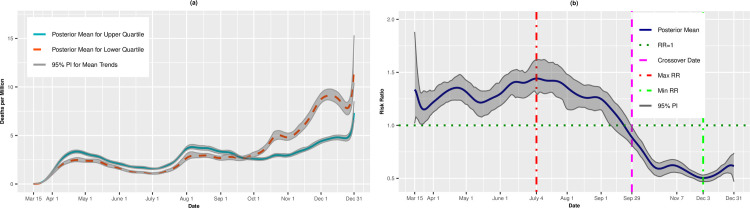
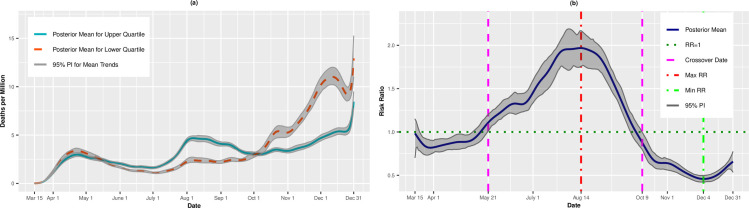
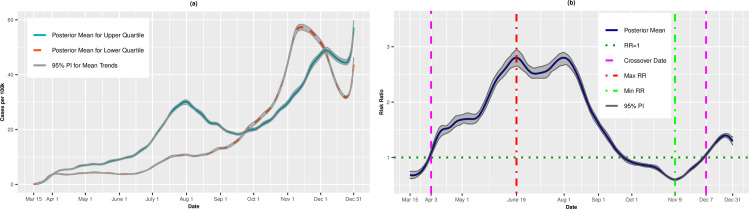
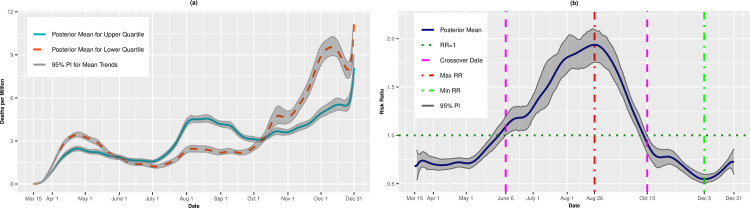
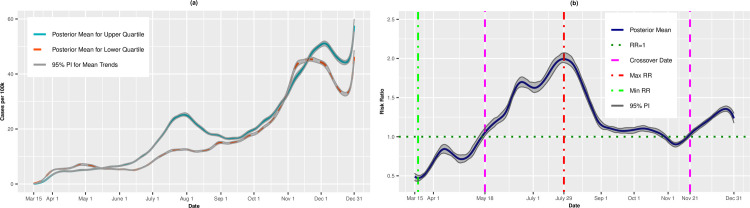
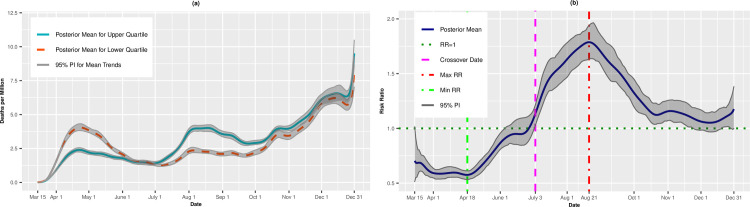
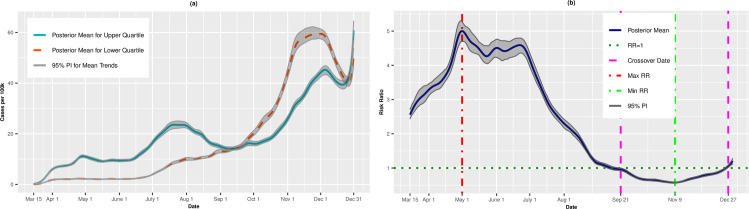
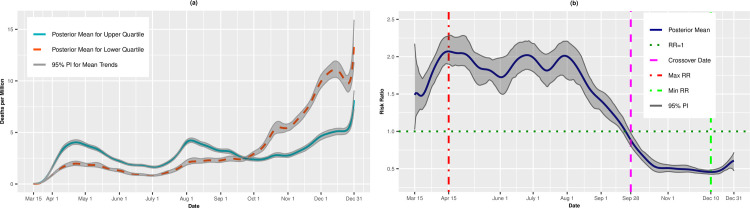
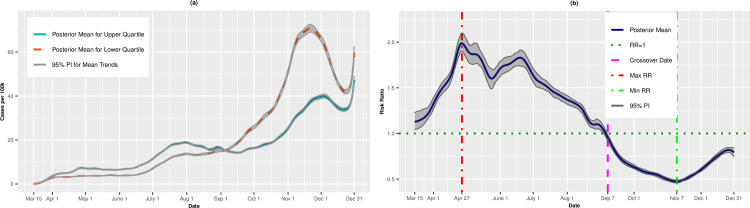
At the outset of the pandemic, the most vulnerable counties had, on average, fewer cases per 100,000 than least vulnerable SVI quartile. However, on March 28, we observed a crossover effect in which the most vulnerable counties experienced higher COVID-19 incidence rates compared to the least vulnerable counties (RR = 1.05, 95% PI: 0.98, 1.12). Vulnerable counties had higher death rates starting on May 21 (RR = 1.08, 95% PI: 1.00,1.16). However, by October, this trend reversed and the most vulnerable counties had lower death rates compared to least vulnerable counties.

CONCLUSIONS

The impact of COVID-19 is not static but can migrate from less vulnerable counties to more vulnerable counties and back again over time.

摘要

背景

在美国,社会弱势群体社区可能面临更高的 COVID-19 爆发风险。然而,之前没有研究考察社会脆弱性对 COVID-19 发病率和死亡率的时间趋势和差异影响。因此,我们研究了社会脆弱性程度较高和较低的县的时间趋势,以量化随着时间的推移趋势的差异。

方法

我们使用来自 USAFacts 的数据,对 2020 年 3 月 15 日至 12 月 31 日期间每个美国县的 COVID-19 发病率和死亡率进行了一项纵向分析。我们使用疾病控制与预防中心的社会脆弱性指数(SVI)对县进行分类,该指数是基于百分位数的衡量标准,数值越高表示脆弱性越高。使用贝叶斯分层负二项模型,我们估计了比较 SVI 第一(较低)和第四(较高)四分位数的县的每日风险比(RR),调整了农村、健康状况不佳或中等的百分比、女性百分比、吸烟者百分比、县平均每日细颗粒物(PM2.5)、每 10 万居民的初级保健医生比例、每日温度和降水以及 COVID-19 检测比例。

结果

在大流行开始时,最脆弱的县每 10 万人口的病例数平均少于最不脆弱的 SVI 四分位数。然而,在 3 月 28 日,我们观察到一个交叉效应,即最脆弱的县的 COVID-19 发病率高于最不脆弱的县(RR = 1.05,95%PI:0.98,1.12)。从 5 月 21 日开始,脆弱县的死亡率更高(RR = 1.08,95%PI:1.00,1.16)。然而,到 10 月,这种趋势发生了逆转,最脆弱的县的死亡率低于最不脆弱的县。

结论

COVID-19 的影响不是静态的,而是随着时间的推移可以从脆弱性较低的县转移到脆弱性较高的县,然后再返回。

https://cdn.ncbi.nlm.nih.gov/pmc/blobs/68ae/7990180/b202418c2776/pone.0248702.g010.jpg
https://cdn.ncbi.nlm.nih.gov/pmc/blobs/68ae/7990180/33b68ee125a7/pone.0248702.g001.jpg
https://cdn.ncbi.nlm.nih.gov/pmc/blobs/68ae/7990180/8cb091082e3f/pone.0248702.g002.jpg
https://cdn.ncbi.nlm.nih.gov/pmc/blobs/68ae/7990180/4d4de7d73054/pone.0248702.g003.jpg
https://cdn.ncbi.nlm.nih.gov/pmc/blobs/68ae/7990180/23aed1c28957/pone.0248702.g004.jpg
https://cdn.ncbi.nlm.nih.gov/pmc/blobs/68ae/7990180/ca0519f7b65b/pone.0248702.g005.jpg
https://cdn.ncbi.nlm.nih.gov/pmc/blobs/68ae/7990180/1c75bc7ccb00/pone.0248702.g006.jpg
https://cdn.ncbi.nlm.nih.gov/pmc/blobs/68ae/7990180/fa69485ad5d3/pone.0248702.g007.jpg
https://cdn.ncbi.nlm.nih.gov/pmc/blobs/68ae/7990180/ee4dd5391039/pone.0248702.g008.jpg
https://cdn.ncbi.nlm.nih.gov/pmc/blobs/68ae/7990180/7f9a2ede1a74/pone.0248702.g009.jpg
https://cdn.ncbi.nlm.nih.gov/pmc/blobs/68ae/7990180/b202418c2776/pone.0248702.g010.jpg

相似文献

1
Spatial and temporal trends in social vulnerability and COVID-19 incidence and death rates in the United States.美国社会脆弱性与 COVID-19 发病率和死亡率的时空趋势。
PLoS One. 2021 Mar 24;16(3):e0248702. doi: 10.1371/journal.pone.0248702. eCollection 2021.
2
Spatial and temporal trends in social vulnerability and COVID-19 incidence and death rates in the United States.美国社会脆弱性以及新冠病毒病发病率和死亡率的时空趋势
medRxiv. 2020 Sep 11:2020.09.09.20191643. doi: 10.1101/2020.09.09.20191643.
3
Temporal trends in the association of social vulnerability and race/ethnicity with county-level COVID-19 incidence and outcomes in the USA: an ecological analysis.美国县级社会脆弱性和种族/民族与新冠病毒疾病发病率及转归之间关联的时间趋势:一项生态分析
BMJ Open. 2021 Jul 22;11(7):e048086. doi: 10.1136/bmjopen-2020-048086.
4
Ecological Analysis of the Temporal Trends in the Association of Social Vulnerability and Race/Ethnicity with County-Level COVID-19 Incidence and Outcomes in the United States.美国社会脆弱性与种族/民族与县级新冠病毒疾病发病率及转归之间关联的时间趋势的生态学分析
medRxiv. 2021 Jun 7:2021.06.04.21258355. doi: 10.1101/2021.06.04.21258355.
5
Impact of Social Vulnerability on COVID-19 Incidence and Outcomes in the United States.社会脆弱性对美国新冠肺炎发病率及结局的影响
medRxiv. 2020 Apr 17:2020.04.10.20060962. doi: 10.1101/2020.04.10.20060962.
6
Patterns in COVID-19 Vaccination Coverage, by Social Vulnerability and Urbanicity - United States, December 14, 2020-May 1, 2021.**新冠病毒疫苗接种覆盖情况的模式,按社会脆弱性和城市人口划分 - 美国,2020 年 12 月 14 日至 2021 年 5 月 1 日。**
MMWR Morb Mortal Wkly Rep. 2021 Jun 4;70(22):818-824. doi: 10.15585/mmwr.mm7022e1.
7
Association of Social and Demographic Factors With COVID-19 Incidence and Death Rates in the US.社会人口因素与美国 COVID-19 发病率和死亡率的关联。
JAMA Netw Open. 2021 Jan 4;4(1):e2036462. doi: 10.1001/jamanetworkopen.2020.36462.
8
County-Level COVID-19 Vaccination Coverage and Social Vulnerability - United States, December 14, 2020-March 1, 2021.县级 COVID-19 疫苗接种覆盖率与社会脆弱性-美国,2020 年 12 月 14 日-2021 年 3 月 1 日。
MMWR Morb Mortal Wkly Rep. 2021 Mar 26;70(12):431-436. doi: 10.15585/mmwr.mm7012e1.
9
Duration of Behavioral Policy Interventions and Incidence of COVID-19 by Social Vulnerability of US Counties, April-December 2020.2020 年 4 月至 12 月期间,美国县的社会脆弱性与行为政策干预持续时间和 COVID-19 发病率的关系。
Public Health Rep. 2023 Jan-Feb;138(1):190-199. doi: 10.1177/00333549221125202. Epub 2022 Oct 6.
10
Social Vulnerability Is Associated with Risk of COVID-19 Related Mortality in U.S. Counties with Confirmed Cases.社会脆弱性与美国有确诊病例的县的 COVID-19 相关死亡率有关。
J Health Care Poor Underserved. 2021;32(1):245-257. doi: 10.1353/hpu.2021.0022.

引用本文的文献

1
Increasing COVID-19 Testing and Vaccination Uptake in the Take Care Texas Community-Based Randomized Trial: Adaptive Geospatial Analysis.在德克萨斯州“关爱社区”基于社区的随机试验中提高新冠病毒检测率和疫苗接种率:适应性地理空间分析
JMIR Form Res. 2025 Feb 11;9:e62802. doi: 10.2196/62802.
2
Utilization of Telemedicine for Patients Receiving In-Center Hemodialysis in the United States.美国针对接受中心血液透析患者的远程医疗应用
J Am Soc Nephrol. 2025 Jan 16;36(7):1380-1390. doi: 10.1681/ASN.0000000619.
3
Using EMS data to explore community-level factors associated with firearm violence in North Carolina.

本文引用的文献

1
Bayesian Zero-Inflated Negative Binomial Regression Based on Pólya-Gamma Mixtures.基于波利亚-伽马混合的贝叶斯零膨胀负二项回归
Bayesian Anal. 2019 Sep;14(3):829-855. doi: 10.1214/18-ba1132. Epub 2019 Jun 11.
2
The spatial association of social vulnerability with COVID-19 prevalence in the contiguous United States.美国本土社会脆弱性与新冠病毒病患病率的空间关联
Int J Environ Health Res. 2022 May;32(5):1147-1154. doi: 10.1080/09603123.2020.1847258. Epub 2020 Nov 23.
3
Air pollution and COVID-19 mortality in the United States: Strengths and limitations of an ecological regression analysis.
利用紧急医疗服务(EMS)数据探索北卡罗来纳州与枪支暴力相关的社区层面因素。
Inj Epidemiol. 2024 Oct 25;11(1):58. doi: 10.1186/s40621-024-00539-9.
4
COVID-19 Deaths and Minority Health Social Vulnerability, in the U.S., January 1, 2020 through June 24, 2023.2020年1月1日至2023年6月24日美国新冠死亡病例与少数族裔健康社会脆弱性
J Racial Ethn Health Disparities. 2024 Oct 11. doi: 10.1007/s40615-024-02192-w.
5
COVID-19 Mortality Disparities Among Socially Vulnerable Medicare Beneficiaries Associated With the Quality of Nurse Work Environments in U.S. Hospitals.美国医院护士工作环境质量与社会弱势群体医疗保险受益人的 COVID-19 死亡率差异相关。
Inquiry. 2024 Jan-Dec;61:469580241284959. doi: 10.1177/00469580241284959.
6
Evolving patterns of COVID-19 mortality in US counties: A longitudinal study of healthcare, socioeconomic, and vaccination associations.美国各县新冠病毒疾病死亡率的演变模式:一项关于医疗保健、社会经济和疫苗接种关联的纵向研究。
PLOS Glob Public Health. 2024 Sep 10;4(9):e0003590. doi: 10.1371/journal.pgph.0003590. eCollection 2024.
7
Association of US county-level social vulnerability index with breast, colorectal, and lung cancer screening, incidence, and mortality rates across US counties.美国县级社会脆弱性指数与美国各县乳腺癌、结直肠癌和肺癌筛查、发病率及死亡率的关联
Front Oncol. 2024 Aug 7;14:1422475. doi: 10.3389/fonc.2024.1422475. eCollection 2024.
8
The Use of Telemedicine by US Nephrologists for In-Center Hemodialysis Care During the Pandemic: An Analysis of National Medicare Claims.美国肾病学家在疫情期间使用远程医疗进行中心内血液透析护理:对国家医疗保险索赔的分析
Kidney Med. 2024 Feb 17;6(4):100798. doi: 10.1016/j.xkme.2024.100798. eCollection 2024 Apr.
9
An Application of Social Vulnerability Index to Infant Mortality Rates in Ohio Using Geospatial Analysis- A Cross-Sectional Study.应用社会脆弱性指数对俄亥俄州婴儿死亡率进行地理空间分析——一项横断面研究。
Matern Child Health J. 2024 Jun;28(6):999-1009. doi: 10.1007/s10995-024-03925-3. Epub 2024 Mar 5.
10
Association Between Social Vulnerability and SARS-CoV-2 Seroprevalence in Specimens Collected From Commercial Laboratories, United States, September 2021-February 2022.2021 年 9 月至 2022 年 2 月期间,从美国商业实验室采集的标本中社会脆弱性与 SARS-CoV-2 血清阳性率之间的关联。
Public Health Rep. 2024 Jul-Aug;139(4):501-511. doi: 10.1177/00333549231223140. Epub 2024 Feb 15.
空气污染与美国新冠肺炎死亡率:生态回归分析的优势与局限
Sci Adv. 2020 Nov 4;6(45). doi: 10.1126/sciadv.abd4049. Print 2020 Nov.
4
State-level needs for social distancing and contact tracing to contain COVID-19 in the United States.美国控制 COVID-19 所需的州级层面的社会隔离和接触者追踪。
Nat Hum Behav. 2020 Oct;4(10):1080-1090. doi: 10.1038/s41562-020-00969-7. Epub 2020 Oct 6.
5
Association of cardiovascular disease and 10 other pre-existing comorbidities with COVID-19 mortality: A systematic review and meta-analysis.心血管疾病与其他 10 种预先存在的合并症与 COVID-19 死亡率的关联:系统评价和荟萃分析。
PLoS One. 2020 Aug 26;15(8):e0238215. doi: 10.1371/journal.pone.0238215. eCollection 2020.
6
Associations Between Primary Care Provider Shortage Areas and County-Level COVID-19 Infection and Mortality Rates in the USA.美国基层医疗服务提供者短缺地区与县级新冠病毒感染率及死亡率之间的关联
J Gen Intern Med. 2020 Nov;35(11):3404-3405. doi: 10.1007/s11606-020-06130-4. Epub 2020 Aug 21.
7
COVID-19 Pandemic: Disparate Health Impact on the Hispanic/Latinx Population in the United States.COVID-19 大流行:美国西班牙裔/拉丁裔人口的健康差异影响。
J Infect Dis. 2020 Oct 13;222(10):1592-1595. doi: 10.1093/infdis/jiaa474.
8
A nicotinic hypothesis for Covid-19 with preventive and therapeutic implications.一种与 COVID-19 相关的烟碱能假说及其预防和治疗意义。
C R Biol. 2020 Jun 5;343(1):33-39. doi: 10.5802/crbiol.8.
9
Risk for COVID-19 infection and death among Latinos in the United States: examining heterogeneity in transmission dynamics.美国拉丁裔人群中感染和死于 COVID-19 的风险:探究传播动态中的异质性。
Ann Epidemiol. 2020 Dec;52:46-53.e2. doi: 10.1016/j.annepidem.2020.07.007. Epub 2020 Jul 23.
10
Disparities in COVID-19 Testing and Positivity in New York City.纽约市 COVID-19 检测和阳性率的差异。
Am J Prev Med. 2020 Sep;59(3):326-332. doi: 10.1016/j.amepre.2020.06.005. Epub 2020 Jun 25.