Santinha João, Matos Celso, Figueiredo Mário, Papanikolaou Nikolaos
Clinical Computational Imaging Group, Champalimaud Research, Champalimaud Foundation, Lisboa, Portugal.
Universidade de Lisboa, Instituto de Telecomunicações, Instituto Superior Técnico, Lisboa, Portugal.
J Med Imaging (Bellingham). 2021 May;8(3):031905. doi: 10.1117/1.JMI.8.3.031905. Epub 2021 Apr 29.
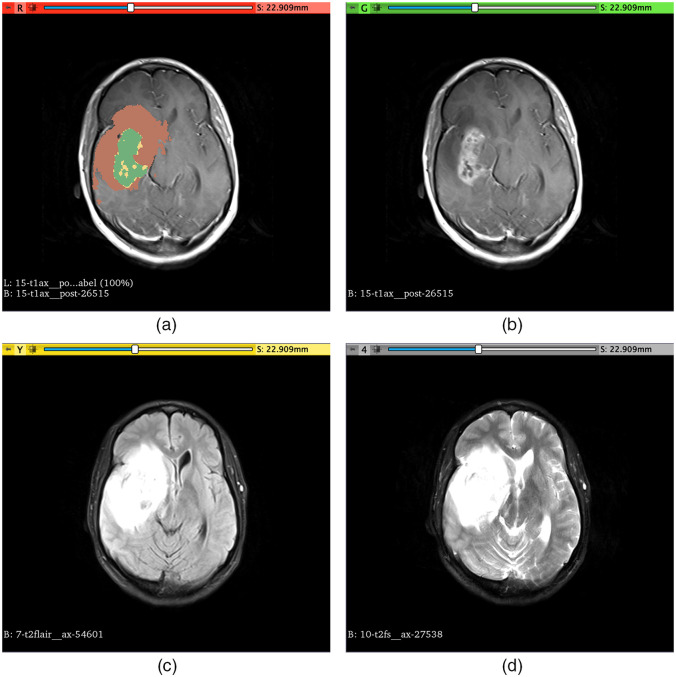
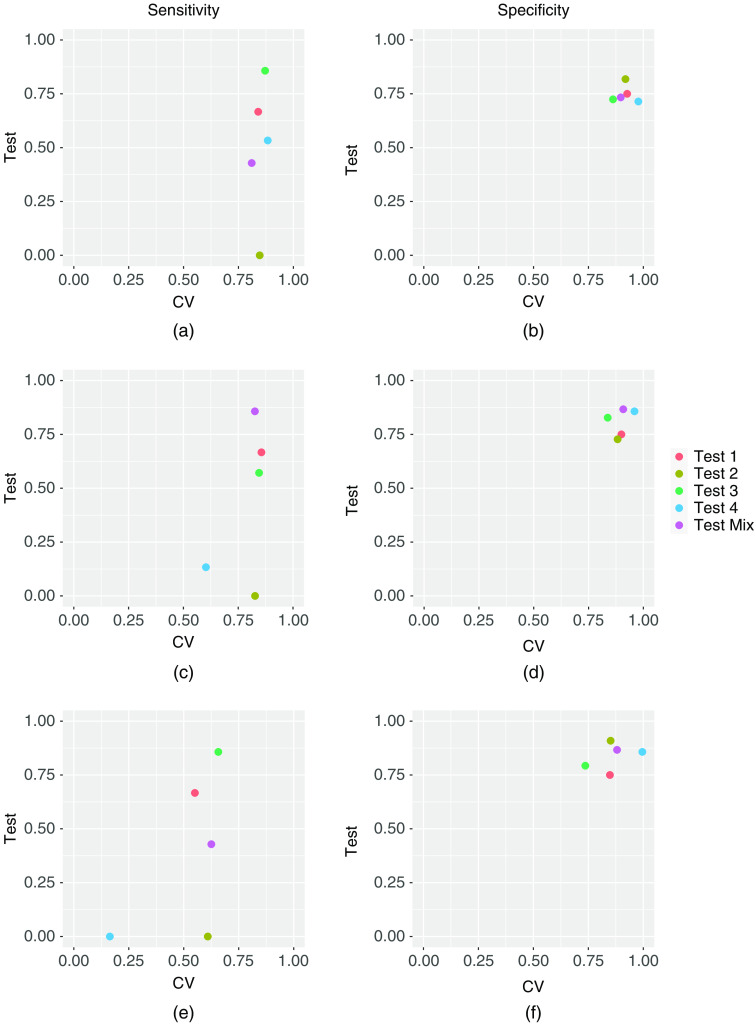
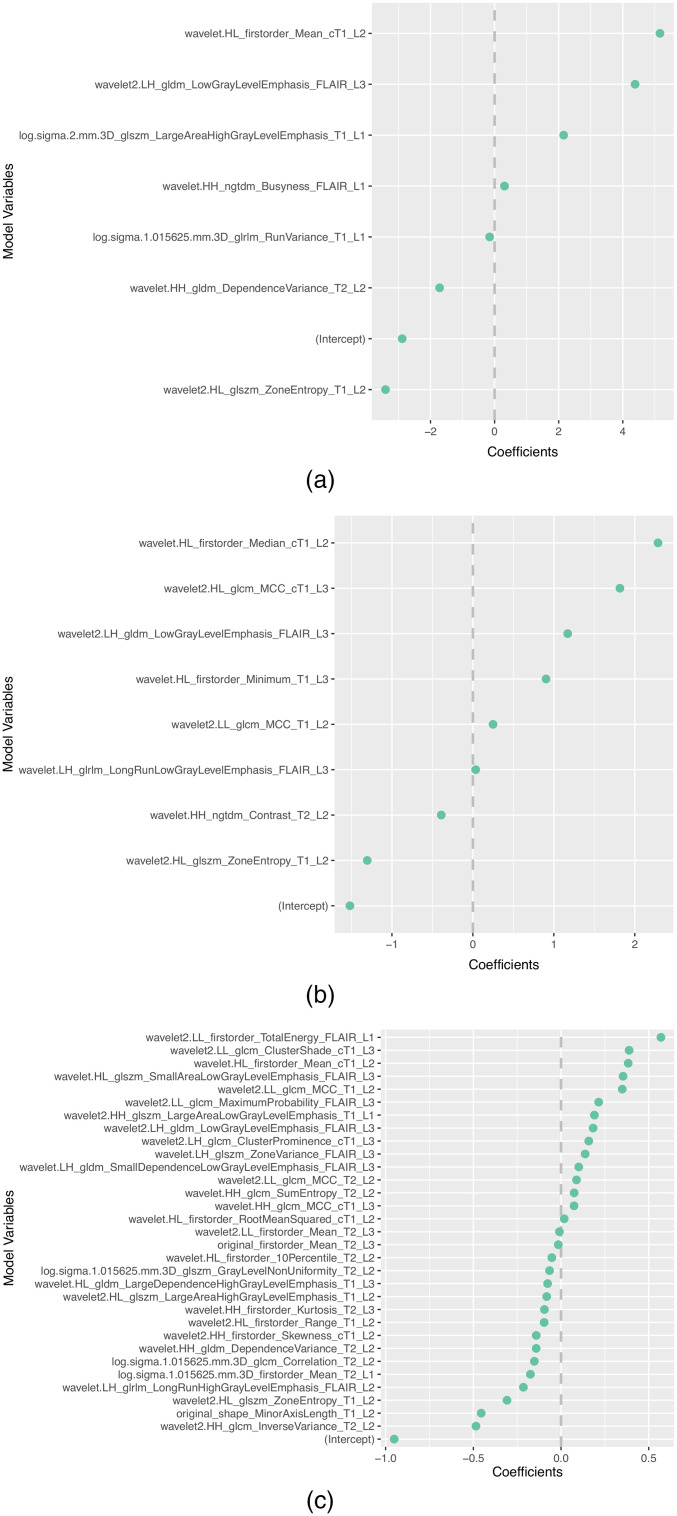
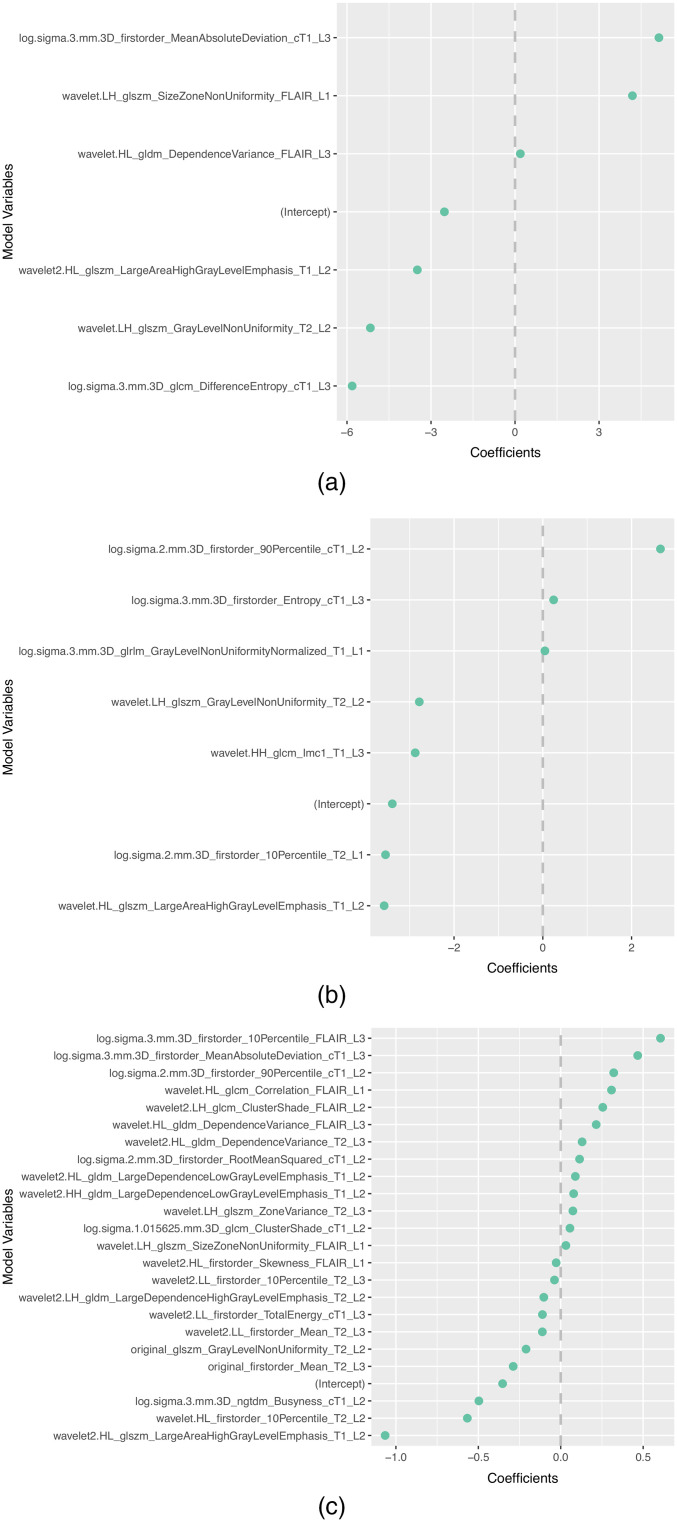
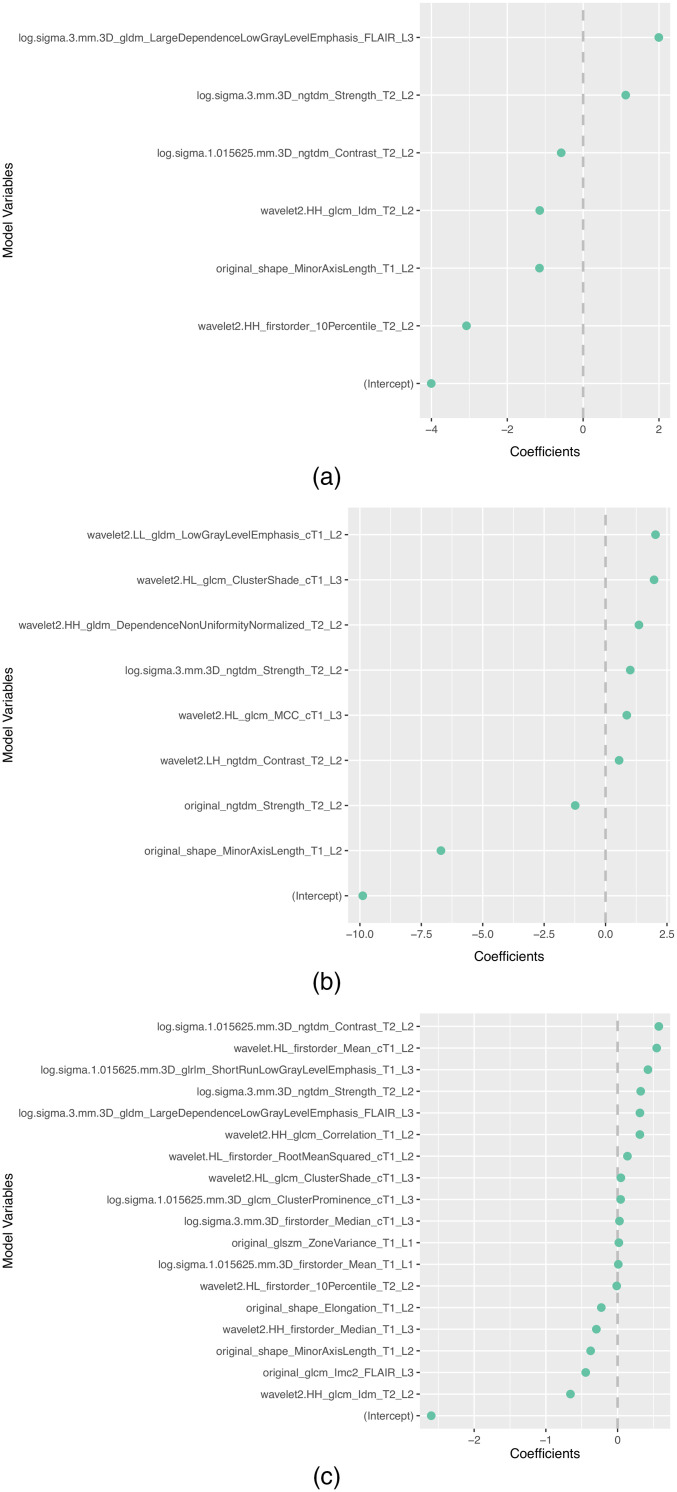
Radiogenomics offers a potential virtual and noninvasive biopsy. However, radiogenomics models often suffer from generalizability issues, which cause a performance degradation on unseen data. In MRI, differences in the sequence parameters, manufacturers, and scanners make this generalizability issue worse. Such image acquisition information may be used to define different environments and select robust and invariant radiomic features associated with the clinical outcome that should be included in radiomics/radiogenomics models. We assessed 77 low-grade gliomas and glioblastomas multiform patients publicly available in TCGA and TCIA. Radiomics features were extracted from multiparametric MRI images (T1-weighted, contrast-enhanced T1-weighted, T2-weighted, and fluid-attenuated inversion recovery) and different regions-of-interest (enhancing tumor, nonenhancing tumor/necrosis, and edema). A method developed to find variables that are part of causal structures was used for feature selection and compared with an embedded feature selection approach commonly used in radiomics/radiogenomics studies, across two different scenarios: (1) leaving data from a center as an independent held-out test set and tuning the model with the data from the remaining centers and (2) use stratified partitioning to obtain the training and the held-out test sets. In scenario (1), the performance of the proposed methodology and the traditional embedded method was AUC: 0.75 [0.25; 1.00] versus 0.83 [0.50; 1.00], Sens.: 0.67 [0.20; 0.93] versus 0.67 [0.20; 0.93], Spec.: 0.75 [0.30; 0.95] versus 0.75 [0.30; 0.95], and MCC: 0.42 [0.19; 0.68] versus 0.42 [0.19; 0.68] for center 1 as the held-out test set. The performance of both methods for center 2 as the held-out test set was AUC: 0.64 [0.36; 0.91] versus 0.55 [0.27; 0.82], Sens.: 0.00 [0.00; 0.73] versus 0.00 [0.00; 0.73], Spec.: 0.82 [0.52; 0.94] versus 0.91 [0.62; 0.98], and MCC: versus , whereas for center 3 was AUC: 0.80 [0.62; 0.95] versus 0.89 [0.56; 0.96], Sens.: 0.86 [0.48; 0.97] versus 0.86 [0.48; 0.97], Spec.: 0.72 [0.54; 0.85] versus 0.79 [0.61; 0.90], and MCC: 0.47 [0.41; 0.53] versus 0.55 [0.48; 0.60]. For center 4, the performance of both methods was AUC: 0.77 [0.51; 1.00] versus 0.75 [0.47; 0.97], Sens.: 0.53 [0.30; 0.75] versus 0.00 [0.00; 0.15], Spec.: 0.71 [0.35; 0.91] versus 0.86 [0.48; 0.97], and MCC: 0.23 [0.16; 0.31] versus. . In scenario (2), the performance of these methods was AUC: 0.89 [0.71; 1.00] versus 0.79 [0.58; 0.94], Sens.: 0.86 [0.80; 0.92] versus 0.43 [0.15; 0.74], Spec.: 0.87 [0.62; 0.96] versus 0.87 [0.62; 0.96], and MCC: 0.70 [0.60; 0.77] versus 0.33 [0.24; 0.42]. This proof-of-concept study demonstrated good performance by the proposed feature selection method in the majority of the studied scenarios, as it promotes robustness of features included in the models and the models' generalizability by making used imaging data of different scanners or with sequence parameters.
放射基因组学提供了一种潜在的虚拟无创活检方法。然而,放射基因组学模型常常存在泛化性问题,这会导致在未见数据上的性能下降。在磁共振成像(MRI)中,序列参数、制造商和扫描仪的差异使这个泛化性问题更加严重。此类图像采集信息可用于定义不同的环境,并选择与临床结果相关的稳健且不变的放射组学特征,这些特征应纳入放射组学/放射基因组学模型。我们评估了公开可用的来自癌症基因组图谱(TCGA)和癌症成像存档(TCIA)的77例低级别胶质瘤和多形性胶质母细胞瘤患者。从多参数MRI图像(T1加权、对比增强T1加权、T2加权和液体衰减反转恢复序列)以及不同的感兴趣区域(强化肿瘤、非强化肿瘤/坏死和水肿)中提取放射组学特征。一种用于寻找作为因果结构一部分的变量的方法被用于特征选择,并与放射组学/放射基因组学研究中常用的嵌入式特征选择方法进行比较,涵盖两种不同情况:(1)将来自一个中心的数据留作独立的验证测试集,并使用其余中心的数据对模型进行调优;(2)使用分层划分来获得训练集和验证测试集。在情况(1)中,将中心1的数据留作验证测试集时,所提出方法和传统嵌入式方法的性能为:曲线下面积(AUC):0.75 [0.25; 1.00] 对比 0.83 [0.50; 1.00],灵敏度(Sens.):0.67 [0.20; 0.93] 对比 0.67 [0.20; 0.93],特异度(Spec.):0.75 [0.30; 0.95] 对比 0.75 [0.30; 0.95],马修斯相关系数(MCC):0.42 [0.19; 0.68] 对比 0.42 [0.19; 0.68]。将中心2的数据留作验证测试集时,两种方法的性能为:AUC:0.64 [0.36; 0.91] 对比 0.55 [0.27; 0.82],Sens.:0.00 [0.00; 0.73] 对比 0.00 [0.00; 0.73],Spec.:0.82 [0.52; 0.94] 对比 0.91 [0.62; 0.98],MCC:[此处原文缺失部分内容] 对比 [此处原文缺失部分内容];而对于中心3,性能为:AUC:0.80 [0.62; 0.95] 对比 0.89 [0.56; 0.96],Sens.:0.86 [0.48; 0.97] 对比 0.86 [0.48; 0.97],Spec.:0.72 [0.54; 0.85] 对比 0.79 [0.61; 0.90],MCC:0.47 [0.41; 0.53] 对比 0.55 [0.48; 0.60]。对于中心4,两种方法的性能为:AUC:0.77 [0.51; 1.00] 对比 0.75 [0.47; 0.97],Sens.:0.53 [0.30; 0.75] 对比 0.00 [0.00; 0.15],Spec.:0.71 [0.35; 0.91] 对比 0.86 [0.48; 0.97],MCC:0.23 [0.16; 0.31] 对比 [此处原文缺失部分内容]。在情况(2)中,这些方法的性能为:AUC:0.89 [0.71; 1.00] 对比 0.79 [0.58; 0.94],Sens.:0.86 [0.80; 0.92] 对比 0.43 [0.15; 0.74],Spec.:0.87 [0.62; 0.96] 对比 0.87 [0.62; 0.96],MCC:0.70 [0.60; 0.77] 对比 0.33 [0.24; 0.42]。这项概念验证研究表明,在所研究的大多数情况下,所提出的特征选择方法具有良好的性能,因为它通过利用不同扫描仪或具有不同序列参数的成像数据,提高了模型中所包含特征的稳健性以及模型的泛化性。