• 文献检索
  • 文档翻译
  • 深度研究
  • 学术资讯
  • Suppr Zotero 插件Zotero 插件
  • 邀请有礼
  • 套餐&价格
  • 历史记录
应用&插件
Suppr Zotero 插件Zotero 插件浏览器插件Mac 客户端Windows 客户端微信小程序
定价
高级版会员购买积分包购买API积分包
服务
文献检索文档翻译深度研究API 文档MCP 服务
关于我们
关于 Suppr公司介绍联系我们用户协议隐私条款
关注我们

Suppr 超能文献

核心技术专利:CN118964589B侵权必究
粤ICP备2023148730 号-1Suppr @ 2026

文献检索

告别复杂PubMed语法,用中文像聊天一样搜索,搜遍4000万医学文献。AI智能推荐,让科研检索更轻松。

立即免费搜索

文件翻译

保留排版,准确专业,支持PDF/Word/PPT等文件格式,支持 12+语言互译。

免费翻译文档

深度研究

AI帮你快速写综述,25分钟生成高质量综述,智能提取关键信息,辅助科研写作。

立即免费体验

首次全面量化 1990 年至 2020 年越南大陆的年度土地利用/覆盖变化。

First comprehensive quantification of annual land use/cover from 1990 to 2020 across mainland Vietnam.

机构信息

Graduate School of Science and Technology, University of Tsukuba, Tennoudai 1-1-1, Tsukuba, Ibaraki, 305-8572, Japan.

Hydraulic Construction Institute, Vietnam Academy for Water Resources, No. 3, Alley 95, Chua Boc Street, Dong Da district, Hanoi, 116765, Vietnam.

出版信息

Sci Rep. 2021 May 11;11(1):9979. doi: 10.1038/s41598-021-89034-5.

DOI:10.1038/s41598-021-89034-5
PMID:33976255
原文链接:https://pmc.ncbi.nlm.nih.gov/articles/PMC8113344/
Abstract

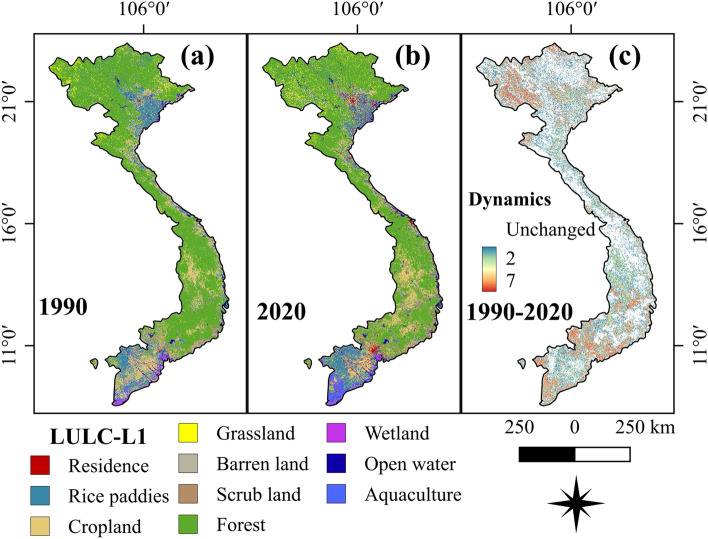
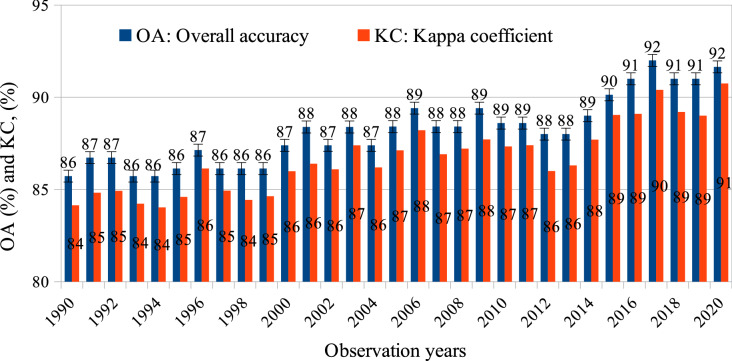
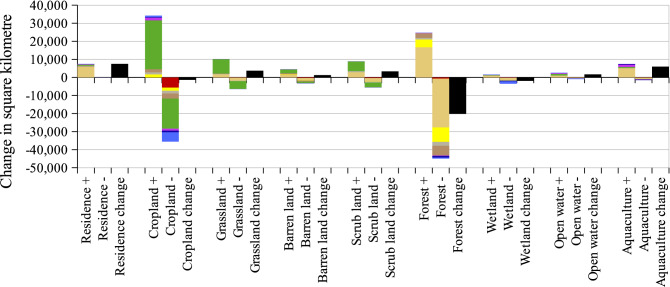
Extensive studies have highlighted a need for frequently consistent land cover information for interdisciplinary studies. This paper proposes a comprehensive framework for the automatic production of the first Vietnam-wide annual land use/land cover (LULC) data sets (VLUCDs) from 1990 to 2020, using available remotely sensed and inventory data. Classification accuracies ranged from 85.7 ± 1.3 to 92.0 ± 1.2% with the primary dominant LULC and 77.6 ± 1.2% to 84.7 ± 1.1% with the secondary dominant LULC. This confirmed the potential of the proposed framework for systematically long-term monitoring LULC in Vietnam. Results reveal that despite slight recoveries in 2000 and 2010, the net loss of forests (19,940 km) mainly transformed to croplands over 30 years. Meanwhile, productive croplands were converted to urban areas, which increased approximately ten times. A threefold increase in aquaculture was a major driver of the wetland loss (1914 km). The spatial-temporal changes varied, but the most dynamic regions were the western north, the southern centre, and the south. These findings can provide evidence-based information on formulating and implementing coherent land management policies. The explicitly spatio-temporal VLUCDs can be benchmarks for global LULC validation, and utilized for a variety of applications in the research of environmental changes towards the Sustainable Development Goals.

摘要

大量研究强调了在跨学科研究中需要频繁一致的土地覆盖信息。本文提出了一个综合框架,用于自动生成 1990 年至 2020 年越南全国范围的土地利用/土地覆盖(LULC)数据集(VLUCD),利用现有遥感和清单数据。主要优势土地利用/土地覆盖的分类精度范围为 85.7 ± 1.3%至 92.0 ± 1.2%,次要优势土地利用/土地覆盖的分类精度范围为 77.6 ± 1.2%至 84.7 ± 1.1%。这证实了该框架在越南系统地长期监测土地利用/土地覆盖方面的潜力。结果表明,尽管 2000 年和 2010 年略有恢复,但30 年来,森林(19940 公里)的净损失主要转化为耕地。同时,生产性耕地被转化为城市地区,增长了近十倍。水产养殖增加了三倍,是湿地损失(1914 公里)的主要驱动因素。时空变化有所不同,但最活跃的地区是西北部、中心南部和南部。这些发现可以为制定和实施连贯的土地管理政策提供基于证据的信息。明确的时空 VLUCD 可以作为全球 LULC 验证的基准,并可用于研究环境变化以实现可持续发展目标的各种应用。

https://cdn.ncbi.nlm.nih.gov/pmc/blobs/79ac/8113344/67ad4f9b0286/41598_2021_89034_Fig8_HTML.jpg
https://cdn.ncbi.nlm.nih.gov/pmc/blobs/79ac/8113344/b99478df5dbc/41598_2021_89034_Fig1_HTML.jpg
https://cdn.ncbi.nlm.nih.gov/pmc/blobs/79ac/8113344/63599519100b/41598_2021_89034_Fig2_HTML.jpg
https://cdn.ncbi.nlm.nih.gov/pmc/blobs/79ac/8113344/1a86b56f1bb4/41598_2021_89034_Fig3_HTML.jpg
https://cdn.ncbi.nlm.nih.gov/pmc/blobs/79ac/8113344/dc01439e1dd4/41598_2021_89034_Fig7_HTML.jpg
https://cdn.ncbi.nlm.nih.gov/pmc/blobs/79ac/8113344/67ad4f9b0286/41598_2021_89034_Fig8_HTML.jpg

相似文献

1
First comprehensive quantification of annual land use/cover from 1990 to 2020 across mainland Vietnam.首次全面量化 1990 年至 2020 年越南大陆的年度土地利用/覆盖变化。
Sci Rep. 2021 May 11;11(1):9979. doi: 10.1038/s41598-021-89034-5.
2
A time series of land cover maps of South Asia from 2001 to 2015 generated using AVHRR GIMMS NDVI3g data.利用 AVHRR GIMMS NDVI3g 数据生成的 2001 年至 2015 年南亚土地覆盖物时间序列地图。
Environ Sci Pollut Res Int. 2020 Jun;27(16):20309-20320. doi: 10.1007/s11356-020-08433-9. Epub 2020 Apr 2.
3
Monitoring land use land cover changes in the Eastern Himalayan landscape of Nagaland, Northeast India.监测印度东北部那加兰邦东喜马拉雅地区的土地利用和土地覆盖变化。
Environ Monit Assess. 2020 Oct 17;192(11):711. doi: 10.1007/s10661-020-08674-8.
4
Remote sensing strategies to monitoring land use maps with AVHRR and MODIS data over the South Asia regions.利用 AVHRR 和 MODIS 数据进行遥感监测南亚地区土地利用图的策略。
Environ Sci Pollut Res Int. 2023 Mar;30(11):31741-31754. doi: 10.1007/s11356-022-24401-x. Epub 2022 Dec 1.
5
Spatio-Temporal Change of Land Use/Land Cover and Vegetation Using Multi-MODIS Satellite Data, Western Ethiopia.利用多颗 MODIS 卫星数据研究埃塞俄比亚西部土地利用/土地覆盖和植被的时空变化。
ScientificWorldJournal. 2023 Oct 31;2023:7454137. doi: 10.1155/2023/7454137. eCollection 2023.
6
Spatial driving forces of dominant land use/land cover transformations in the Dongjiang River watershed, Southern China.中国南方东江流域主要土地利用/土地覆盖变化的空间驱动力
Environ Monit Assess. 2016 Feb;188(2):84. doi: 10.1007/s10661-015-5088-z. Epub 2016 Jan 8.
7
Environmental monitoring and prediction of land use and land cover spatio-temporal changes: a case study from El-Omayed Biosphere Reserve, Egypt.环境监测与土地利用/土地覆被时空变化预测:以埃及奥梅耶德生物圈保护区为例。
Environ Sci Pollut Res Int. 2020 Dec;27(34):42881-42897. doi: 10.1007/s11356-020-10208-1. Epub 2020 Jul 28.
8
GIS based mapping of land cover changes utilizing multi-temporal remotely sensed image data in Lake Hawassa Watershed, Ethiopia.基于 GIS 的埃塞俄比亚 Hawassa 流域利用多时相遥感影像数据的土地覆盖变化制图。
Environ Monit Assess. 2014 Mar;186(3):1765-80. doi: 10.1007/s10661-013-3491-x. Epub 2013 Dec 6.
9
Land use-land cover change in the Tano basin, Ghana and the implications on sustainable development goals.加纳塔诺河流域的土地利用-土地覆盖变化及其对可持续发展目标的影响。
Heliyon. 2023 Mar 24;9(4):e14859. doi: 10.1016/j.heliyon.2023.e14859. eCollection 2023 Apr.
10
Analysis of the relationship among land surface temperature (LST), land use land cover (LULC), and normalized difference vegetation index (NDVI) with topographic elements in the lower Himalayan region.喜马拉雅山脉低海拔地区地表温度(LST)、土地利用土地覆盖(LULC)、归一化植被指数(NDVI)与地形要素之间的关系分析
Heliyon. 2023 Feb 3;9(2):e13322. doi: 10.1016/j.heliyon.2023.e13322. eCollection 2023 Feb.

引用本文的文献

1
Land use and landscape pattern changes in the Fenhe River Basin, China.中国汾河流域的土地利用与景观格局变化
Sci Rep. 2025 Jan 20;15(1):2474. doi: 10.1038/s41598-025-86780-8.

本文引用的文献

1
Stable classification with limited sample: transferring a 30-m resolution sample set collected in 2015 to mapping 10-m resolution global land cover in 2017.有限样本下的稳定分类:将2015年收集的30米分辨率样本集用于绘制2017年10米分辨率的全球土地覆盖图。
Sci Bull (Beijing). 2019 Mar 30;64(6):370-373. doi: 10.1016/j.scib.2019.03.002. Epub 2019 Mar 2.
2
Preliminary analysis of the performance of the Landsat 8/OLI land surface reflectance product.陆地卫星8号/OLI地表反射率产品性能的初步分析
Remote Sens Environ. 2016 Apr 28;Volume 185(Iss 2):46-56. doi: 10.1016/j.rse.2016.04.008.
3
Characterization of Landsat-7 to Landsat-8 reflective wavelength and normalized difference vegetation index continuity.
陆地卫星7号至陆地卫星8号反射波长及归一化植被指数连续性的特征分析
Remote Sens Environ. 2016 Jan 12;Volume 185(Iss 1):57-70. doi: 10.1016/j.rse.2015.12.024.
4
Quantifying the biophysical and socioeconomic drivers of changes in forest and agricultural land in South and Southeast Asia.量化南亚和东南亚森林与耕地变化的生物物理和社会经济驱动因素。
Glob Chang Biol. 2019 Jun;25(6):2137-2151. doi: 10.1111/gcb.14611. Epub 2019 Mar 25.
5
Global land change from 1982 to 2016.全球 1982 年至 2016 年土地变化情况。
Nature. 2018 Aug;560(7720):639-643. doi: 10.1038/s41586-018-0411-9. Epub 2018 Aug 8.
6
Future urban land expansion and implications for global croplands.未来城市土地扩张及其对全球耕地的影响。
Proc Natl Acad Sci U S A. 2017 Aug 22;114(34):8939-8944. doi: 10.1073/pnas.1606036114. Epub 2016 Dec 27.
7
High-resolution global maps of 21st-century forest cover change.高分辨率的 21 世纪全球森林覆盖变化地图集。
Science. 2013 Nov 15;342(6160):850-3. doi: 10.1126/science.1244693.
8
Global change and the ecology of cities.全球变化与城市生态学
Science. 2008 Feb 8;319(5864):756-60. doi: 10.1126/science.1150195.