Allieta Mattia, Allieta Andrea, Rossi Sebastiano Davide
Ronin Institute, Montclair, NJ 07043 USA.
Università del Piemonte Orientale "A. Avogadro" Dipartimento di Medicina Traslazionale Anestesia e Rianimazione, Corso Mazzini 18, 28100 Novara, Italy.
Z Gesundh Wiss. 2022;30(11):2719-2727. doi: 10.1007/s10389-021-01567-1. Epub 2021 May 21.
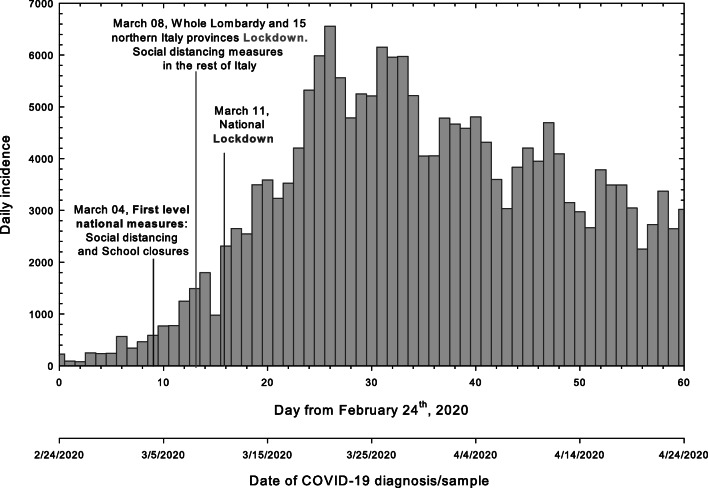
Two months after its first COVID-19 case, Italy counted more than 190,000 confirmed positive cases. From the beginning of April 2020, the nationwide lockdown started to show early effects by reducing the total cumulative incidence reached by the epidemic wave. Here we provide the reproduction number estimation both in space and in time from February 24 to April 24, 2020 over 2 months into the epidemic.
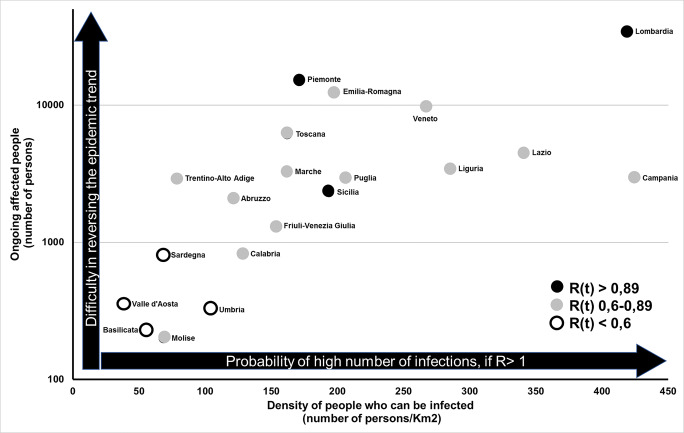
The aim of the present work was to provide a systematical mapping of the SARS-CoV-2 transmission dynamics spread to all regions of Italy. To do so, we estimated the basic reproduction number ( ), by using the maximum likelihood estimation method in the early stage of the epidemic. In addition, we determined time evolution of this parameter across the 2 months of the observational period. Finally, we linked , with two indices, the first representing the number of contagious people and the latter the density of susceptibiltiy to infection of people in a region as recorded on April 24, 2020.
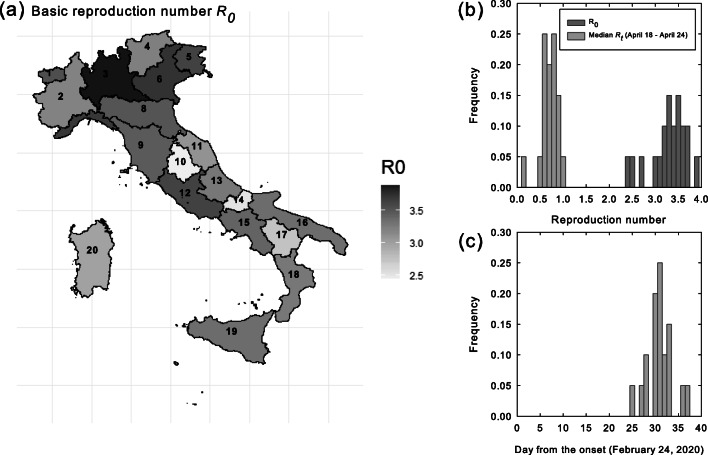
Our estimates suggest a basic reproduction number averaged over all the regions of 3.29. Based on the SARS-CoV-2 transmission dynamics reported here, we gave a quantitative evaluation of the efficiency of the government measures to lower the reproduction number below 1 (control regime). We estimated that the worst-hit regions in Italy reached the control regime level ( < 1) in about a month.
Our work was carried out in the period between April and July,2020. We found that the mean value of time to reach the control regime across the whole country was about 31 days from February 24, 2020. Moreover, we highlighted the interplay between the reproduction number and two epidemiological/demographic indices to evaluate the "state of activity" of the epidemic, potentially helping in challenging decisions to continue, ease, or tighten restrictions.
The online version contains supplementary material available at 10.1007/s10389-021-01567-1.
在出现首例新冠病毒肺炎病例两个月后,意大利确诊阳性病例超过19万例。从2020年4月初开始,全国范围的封锁措施通过降低疫情波所达到的总累计发病率开始显现出早期效果。在此,我们给出了2020年2月24日至4月24日这两个月疫情期间,新冠病毒传播数在空间和时间上的估计。
本研究的目的是对严重急性呼吸综合征冠状病毒2(SARS-CoV-2)在意大利所有地区的传播动态进行系统映射。为此,我们在疫情早期使用最大似然估计法估计了基本再生数(R₀)。此外,我们确定了该参数在两个月观察期内的时间演变。最后,我们将R₀与两个指标联系起来,第一个指标代表具有传染性的人数,第二个指标代表2020年4月24日记录的某地区人群的易感染密度。
我们的估计表明,所有地区的平均基本再生数为3.29。基于此处报告的SARS-CoV-2传播动态,我们对政府将再生数降至1以下(控制状态)的措施效率进行了定量评估。我们估计,意大利受影响最严重的地区大约在一个月内达到了控制状态水平(R₀<1)。
我们的研究在2020年4月至7月期间进行。我们发现,从2020年2月24日起,全国达到控制状态的平均时间约为31天。此外,我们强调了再生数与两个流行病学/人口统计学指标之间的相互作用,以评估疫情的“活跃状态”,这可能有助于做出有关继续、放松或收紧限制措施的具有挑战性的决策。
网络版包含可在10.1007/s10389-021-01567-1获取的补充材料。