• 文献检索
  • 文档翻译
  • 深度研究
  • 学术资讯
  • Suppr Zotero 插件Zotero 插件
  • 邀请有礼
  • 套餐&价格
  • 历史记录
应用&插件
Suppr Zotero 插件Zotero 插件浏览器插件Mac 客户端Windows 客户端微信小程序
定价
高级版会员购买积分包购买API积分包
服务
文献检索文档翻译深度研究API 文档MCP 服务
关于我们
关于 Suppr公司介绍联系我们用户协议隐私条款
关注我们

Suppr 超能文献

核心技术专利:CN118964589B侵权必究
粤ICP备2023148730 号-1Suppr @ 2026

文献检索

告别复杂PubMed语法,用中文像聊天一样搜索,搜遍4000万医学文献。AI智能推荐,让科研检索更轻松。

立即免费搜索

文件翻译

保留排版,准确专业,支持PDF/Word/PPT等文件格式,支持 12+语言互译。

免费翻译文档

深度研究

AI帮你快速写综述,25分钟生成高质量综述,智能提取关键信息,辅助科研写作。

立即免费体验

一种基于新冠肺炎疫情临床和流行病学数据分析的新型SEAIRD大流行预测模型。

A new SEAIRD pandemic prediction model with clinical and epidemiological data analysis on COVID-19 outbreak.

作者信息

Liu Xian-Xian, Fong Simon James, Dey Nilanjan, Crespo Rubén González, Herrera-Viedma Enrique

机构信息

Department of Computer and Information Science, University of Macau, SAR, Macau, China.

DACC Laboratory, Zhuhai Institutes of Advanced Technology of the Chinese Academy of Sciences, Zhuhai, China.

出版信息

Appl Intell (Dordr). 2021;51(7):4162-4198. doi: 10.1007/s10489-020-01938-3. Epub 2021 Jan 1.

DOI:10.1007/s10489-020-01938-3
PMID:34764574
原文链接:https://pmc.ncbi.nlm.nih.gov/articles/PMC7775669/
Abstract

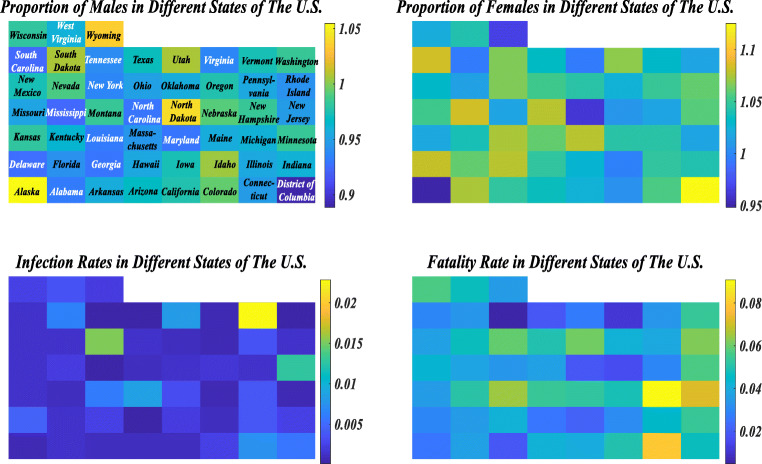
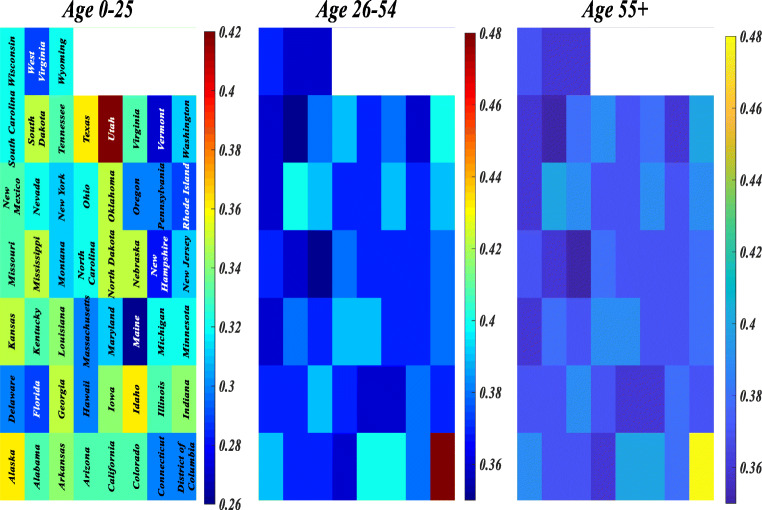
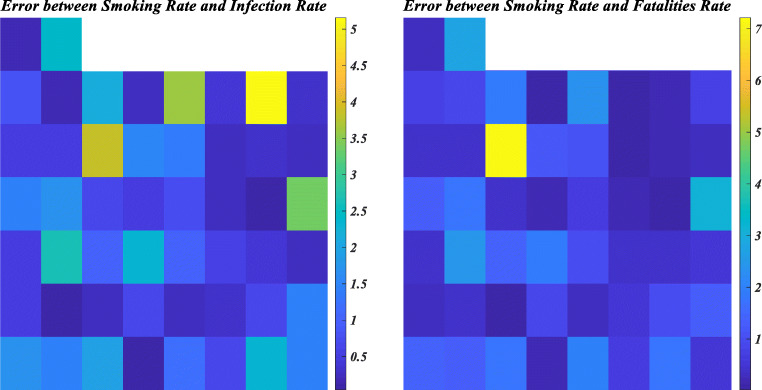
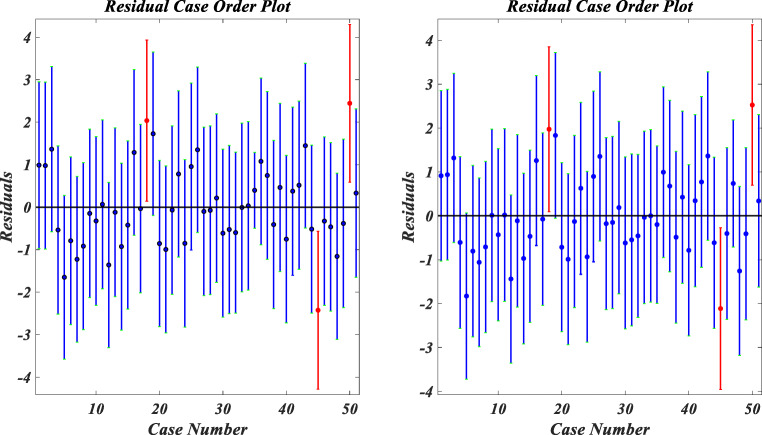
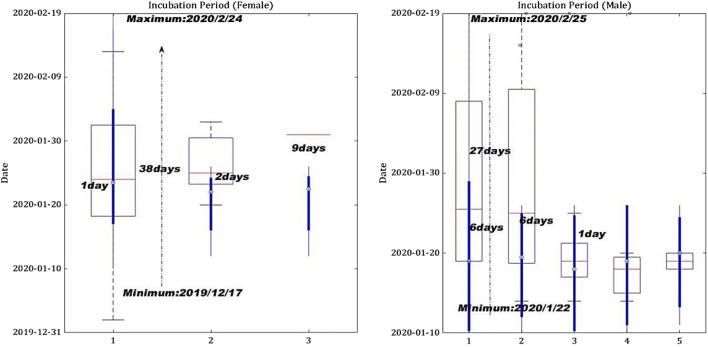
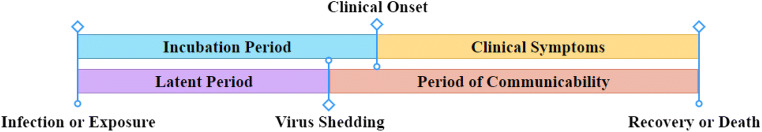
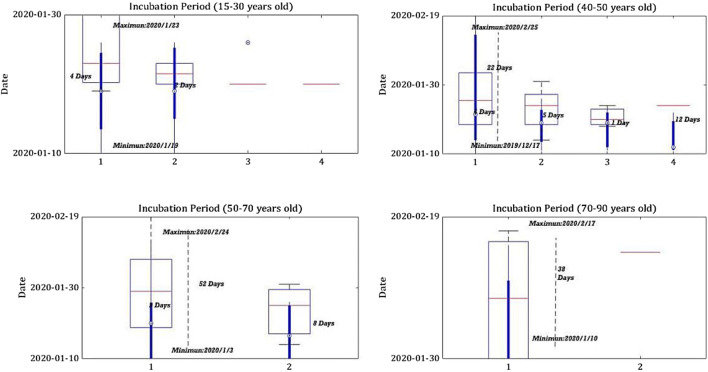
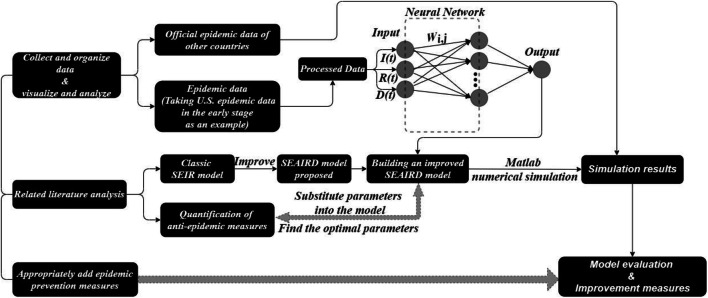
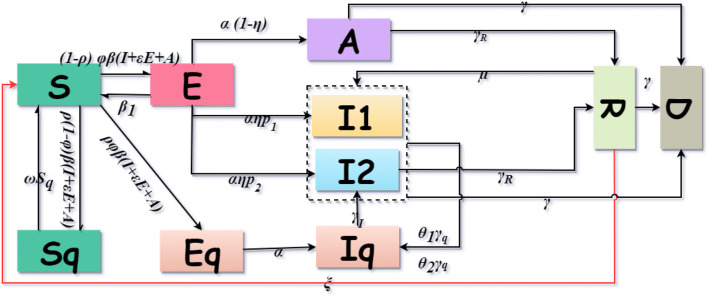
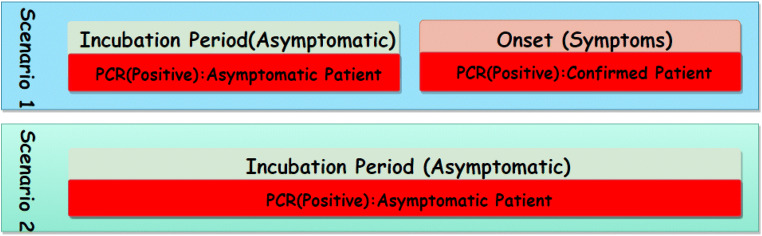
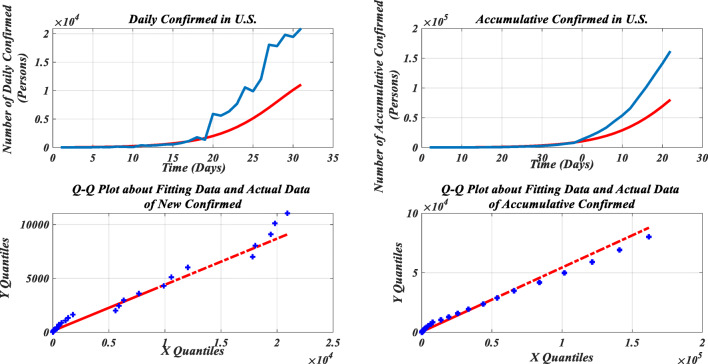
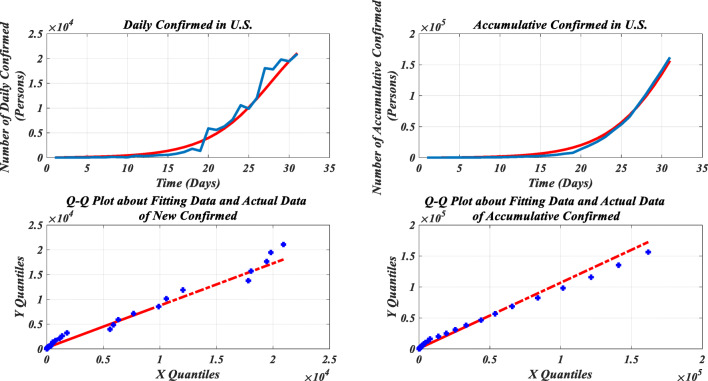
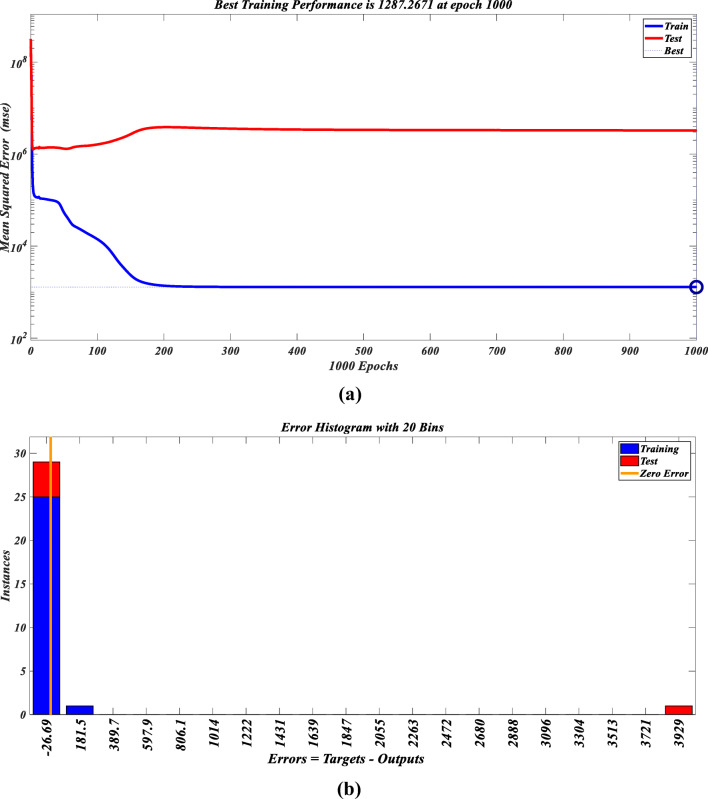
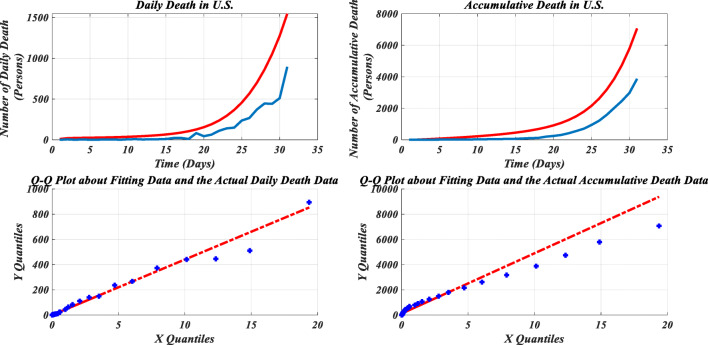
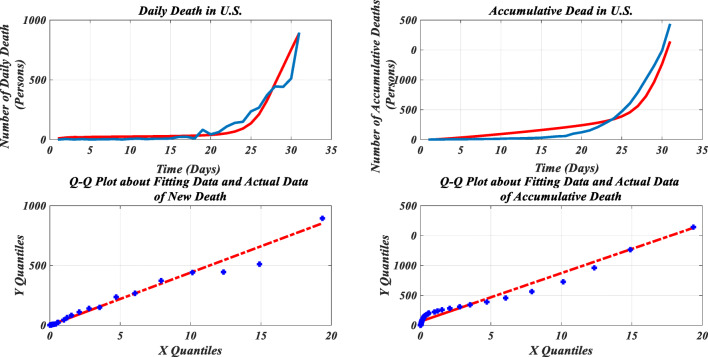
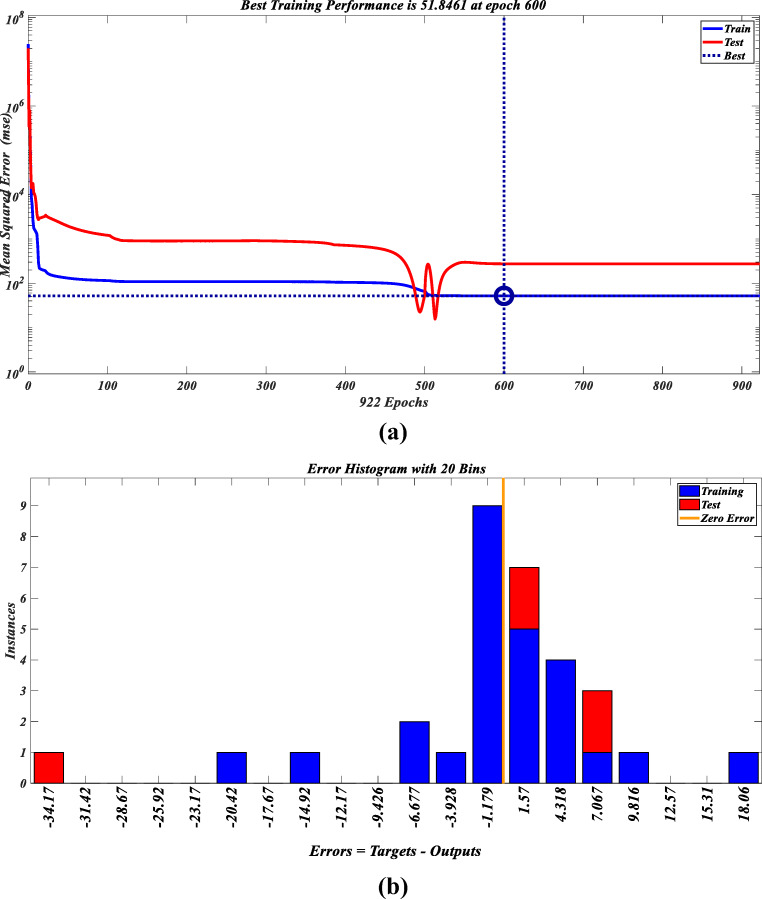
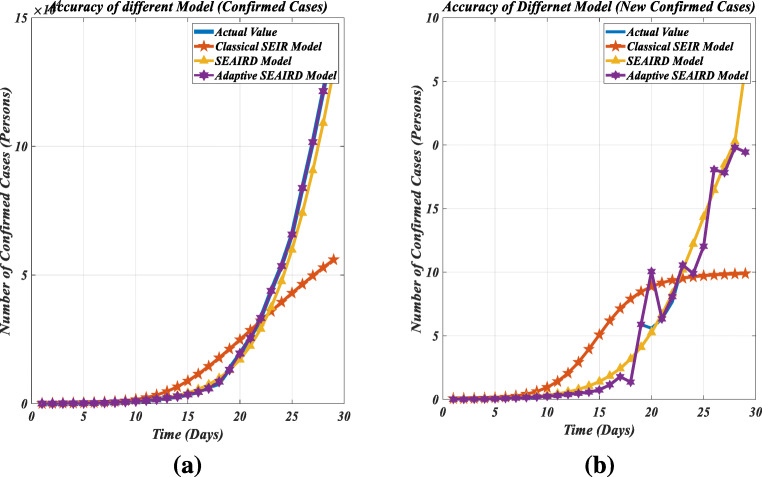
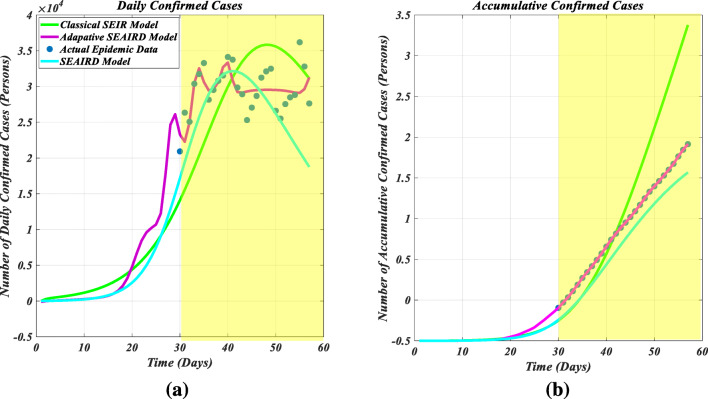
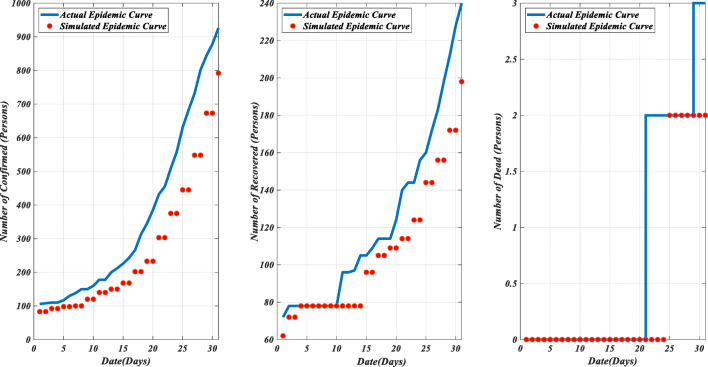
Measuring the spread of disease during a pandemic is critically important for accurately and promptly applying various lockdown strategies, so to prevent the collapse of the medical system. The latest pandemic of COVID-19 that hits the world death tolls and economy loss very hard, is more complex and contagious than its precedent diseases. The complexity comes mostly from the emergence of asymptomatic patients and relapse of the recovered patients which were not commonly seen during SARS outbreaks. These new characteristics pertaining to COVID-19 were only discovered lately, adding a level of uncertainty to the traditional SEIR models. The contribution of this paper is that for the COVID-19 epidemic, which is infectious in both the incubation period and the onset period, we use neural networks to learn from the actual data of the epidemic to obtain optimal parameters, thereby establishing a nonlinear, self-adaptive dynamic coefficient infectious disease prediction model. On the basis of prediction, we considered control measures and simulated the effects of different control measures and different strengths of the control measures. The epidemic control is predicted as a continuous change process, and the epidemic development and control are integrated to simulate and forecast. Decision-making departments make optimal choices. The improved model is applied to simulate the COVID-19 epidemic in the United States, and by comparing the prediction results with the traditional SEIR model, SEAIRD model and adaptive SEAIRD model, it is found that the adaptive SEAIRD model's prediction results of the U.S. COVID-19 epidemic data are in good agreement with the actual epidemic curve. For example, from the prediction effect of these 3 different models on accumulative confirmed cases, in terms of goodness of fit, adaptive SEAIRD model (0.99997) ≈ SEAIRD model (0.98548) > Classical SEIR model (0.66837); in terms of error value: adaptive SEAIRD model (198.6563) < < SEAIRD model(4739.8577) < < Classical SEIR model (22,652.796); The objective of this contribution is mainly on extending the current spread prediction model. It incorporates extra compartments accounting for the new features of COVID-19, and fine-tunes the new model with neural network, in a bid of achieving a higher level of prediction accuracy. Based on the SEIR model of disease transmission, an adaptive model called SEAIRD with internal source and isolation intervention is proposed. It simulates the effects of the changing behaviour of the SARS-CoV-2 in U.S. Neural network is applied to achieve a better fit in SEAIRD. Unlike the SEIR model, the adaptive SEAIRD model embraces multi-group dynamics which lead to different evolutionary trends during the epidemic. Through the risk assessment indicators of the adaptive SEAIRD model, it is convenient to measure the severity of the epidemic situation for consideration of different preventive measures. Future scenarios are projected from the trends of various indicators by running the adaptive SEAIRD model.

摘要

在大流行期间测量疾病传播对于准确、及时地应用各种封锁策略至关重要,以便防止医疗系统崩溃。最近席卷全球、造成惨重死亡人数和经济损失的新冠疫情,比之前的疾病更加复杂且具有传染性。这种复杂性主要源于无症状患者的出现以及康复患者的复发,而这些情况在非典疫情期间并不常见。新冠疫情的这些新特征直到最近才被发现,给传统的SEIR模型增添了一层不确定性。本文的贡献在于,针对在潜伏期和发病期均具有传染性的新冠疫情,我们利用神经网络从疫情实际数据中学习以获得最优参数,从而建立一个非线性、自适应动态系数传染病预测模型。在预测的基础上,我们考虑了控制措施,并模拟了不同控制措施及其不同强度的效果。将疫情控制预测为一个连续变化的过程,把疫情发展与控制结合起来进行模拟和预测,供决策部门做出最优选择。将改进后的模型应用于模拟美国的新冠疫情,通过将预测结果与传统的SEIR模型、SEAIRD模型和自适应SEAIRD模型进行比较,发现自适应SEAIRD模型对美国新冠疫情数据的预测结果与实际疫情曲线吻合良好。例如,从这3种不同模型对累计确诊病例的预测效果来看,在拟合优度方面,自适应SEAIRD模型(0.99997)≈ SEAIRD模型(0.98548)> 经典SEIR模型(0.66837);在误差值方面:自适应SEAIRD模型(198.6563) << SEAIRD模型(4739.8577) << 经典SEIR模型(22652.796)。这一贡献的目标主要是扩展当前的传播预测模型。它纳入了额外的部分以考虑新冠疫情的新特征,并用神经网络对新模型进行微调,以期实现更高水平的预测准确性。基于疾病传播的SEIR模型,提出了一种具有内部来源和隔离干预的自适应模型SEAIRD。它模拟了新冠病毒在美国行为变化的影响。应用神经网络以使SEAIRD模型实现更好的拟合。与SEIR模型不同,自适应SEAIRD模型包含多群体动态,这导致疫情期间出现不同的演变趋势。通过自适应SEAIRD模型的风险评估指标,便于衡量疫情的严重程度,从而考虑不同的预防措施。通过运行自适应SEAIRD模型,根据各种指标的趋势预测未来情况。

https://cdn.ncbi.nlm.nih.gov/pmc/blobs/0a6c/7775669/dadf427d2af5/10489_2020_1938_Fig31_HTML.jpg
https://cdn.ncbi.nlm.nih.gov/pmc/blobs/0a6c/7775669/24e2356a0df9/10489_2020_1938_Fig1_HTML.jpg
https://cdn.ncbi.nlm.nih.gov/pmc/blobs/0a6c/7775669/edbdebef5a37/10489_2020_1938_Fig2_HTML.jpg
https://cdn.ncbi.nlm.nih.gov/pmc/blobs/0a6c/7775669/d43bf984dfcc/10489_2020_1938_Fig3_HTML.jpg
https://cdn.ncbi.nlm.nih.gov/pmc/blobs/0a6c/7775669/25e980752624/10489_2020_1938_Fig4_HTML.jpg
https://cdn.ncbi.nlm.nih.gov/pmc/blobs/0a6c/7775669/e8a7300f185d/10489_2020_1938_Fig5_HTML.jpg
https://cdn.ncbi.nlm.nih.gov/pmc/blobs/0a6c/7775669/49e9ce7102e1/10489_2020_1938_Fig6_HTML.jpg
https://cdn.ncbi.nlm.nih.gov/pmc/blobs/0a6c/7775669/af2019fdb8b5/10489_2020_1938_Fig7_HTML.jpg
https://cdn.ncbi.nlm.nih.gov/pmc/blobs/0a6c/7775669/d33244059709/10489_2020_1938_Fig8_HTML.jpg
https://cdn.ncbi.nlm.nih.gov/pmc/blobs/0a6c/7775669/1fc106f1249c/10489_2020_1938_Fig9_HTML.jpg
https://cdn.ncbi.nlm.nih.gov/pmc/blobs/0a6c/7775669/6e6b783051fc/10489_2020_1938_Fig10_HTML.jpg
https://cdn.ncbi.nlm.nih.gov/pmc/blobs/0a6c/7775669/af77116727fb/10489_2020_1938_Fig11_HTML.jpg
https://cdn.ncbi.nlm.nih.gov/pmc/blobs/0a6c/7775669/1021b18a46c3/10489_2020_1938_Fig12_HTML.jpg
https://cdn.ncbi.nlm.nih.gov/pmc/blobs/0a6c/7775669/d3f6e022190d/10489_2020_1938_Fig13_HTML.jpg
https://cdn.ncbi.nlm.nih.gov/pmc/blobs/0a6c/7775669/66159381718d/10489_2020_1938_Fig14_HTML.jpg
https://cdn.ncbi.nlm.nih.gov/pmc/blobs/0a6c/7775669/02622a527c05/10489_2020_1938_Fig15_HTML.jpg
https://cdn.ncbi.nlm.nih.gov/pmc/blobs/0a6c/7775669/921442cc559c/10489_2020_1938_Fig16a_HTML.jpg
https://cdn.ncbi.nlm.nih.gov/pmc/blobs/0a6c/7775669/541896e487f4/10489_2020_1938_Fig17_HTML.jpg
https://cdn.ncbi.nlm.nih.gov/pmc/blobs/0a6c/7775669/2cdc84d7d06b/10489_2020_1938_Fig18_HTML.jpg
https://cdn.ncbi.nlm.nih.gov/pmc/blobs/0a6c/7775669/9ae3efca8192/10489_2020_1938_Fig19a_HTML.jpg
https://cdn.ncbi.nlm.nih.gov/pmc/blobs/0a6c/7775669/7d17f5c2cbad/10489_2020_1938_Fig20_HTML.jpg
https://cdn.ncbi.nlm.nih.gov/pmc/blobs/0a6c/7775669/8d95b4f705b5/10489_2020_1938_Fig21_HTML.jpg
https://cdn.ncbi.nlm.nih.gov/pmc/blobs/0a6c/7775669/125228ca05c1/10489_2020_1938_Fig22_HTML.jpg
https://cdn.ncbi.nlm.nih.gov/pmc/blobs/0a6c/7775669/d18cdce54b3e/10489_2020_1938_Fig23_HTML.jpg
https://cdn.ncbi.nlm.nih.gov/pmc/blobs/0a6c/7775669/076d4167d456/10489_2020_1938_Fig24_HTML.jpg
https://cdn.ncbi.nlm.nih.gov/pmc/blobs/0a6c/7775669/b324621daea8/10489_2020_1938_Fig25_HTML.jpg
https://cdn.ncbi.nlm.nih.gov/pmc/blobs/0a6c/7775669/6cc606747a32/10489_2020_1938_Fig26_HTML.jpg
https://cdn.ncbi.nlm.nih.gov/pmc/blobs/0a6c/7775669/05f7ae9d373f/10489_2020_1938_Fig27_HTML.jpg
https://cdn.ncbi.nlm.nih.gov/pmc/blobs/0a6c/7775669/e054ddb14a53/10489_2020_1938_Fig28_HTML.jpg
https://cdn.ncbi.nlm.nih.gov/pmc/blobs/0a6c/7775669/76f9bb6e9a6f/10489_2020_1938_Fig29_HTML.jpg
https://cdn.ncbi.nlm.nih.gov/pmc/blobs/0a6c/7775669/d4e62acb58f3/10489_2020_1938_Fig30_HTML.jpg
https://cdn.ncbi.nlm.nih.gov/pmc/blobs/0a6c/7775669/dadf427d2af5/10489_2020_1938_Fig31_HTML.jpg

相似文献

1
A new SEAIRD pandemic prediction model with clinical and epidemiological data analysis on COVID-19 outbreak.一种基于新冠肺炎疫情临床和流行病学数据分析的新型SEAIRD大流行预测模型。
Appl Intell (Dordr). 2021;51(7):4162-4198. doi: 10.1007/s10489-020-01938-3. Epub 2021 Jan 1.
2
Neural-SEIR: A flexible data-driven framework for precise prediction of epidemic disease.神经 SEIR:一个灵活的数据驱动框架,用于精确预测传染病。
Math Biosci Eng. 2023 Aug 23;20(9):16807-16823. doi: 10.3934/mbe.2023749.
3
A Simulation of a COVID-19 Epidemic Based on a Deterministic SEIR Model.基于确定性 SEIR 模型的 COVID-19 疫情模拟。
Front Public Health. 2020 May 28;8:230. doi: 10.3389/fpubh.2020.00230. eCollection 2020.
4
Evaluating the Demand for Nucleic Acid Testing in Different Scenarios of COVID-19 Transmission: A Simulation Study.评估新冠病毒传播不同场景下的核酸检测需求:一项模拟研究
Infect Dis Ther. 2024 Apr;13(4):813-826. doi: 10.1007/s40121-024-00954-x. Epub 2024 Mar 18.
5
From SIR to SEAIRD: A novel data-driven modeling approach based on the Grey-box System Theory to predict the dynamics of COVID-19.从SIR到SEAIRD:一种基于灰箱系统理论的新型数据驱动建模方法,用于预测新冠疫情动态。
Appl Intell (Dordr). 2022;52(1):71-80. doi: 10.1007/s10489-021-02379-2. Epub 2021 Apr 23.
6
An evaluation of COVID-19 transmission control in Wenzhou using a modified SEIR model.温州 COVID-19 传播控制的评价:使用改进的 SEIR 模型。
Epidemiol Infect. 2021 Jan 8;149:e2. doi: 10.1017/S0950268820003064.
7
Coronavirus disease 2019 epidemic prediction in Shanghai under the "dynamic zero-COVID policy" using time-dependent SEAIQR model.基于时间依赖型SEAIQR模型的“动态清零”政策下上海市2019年冠状病毒病疫情预测
J Biosaf Biosecur. 2022 Dec;4(2):105-113. doi: 10.1016/j.jobb.2022.06.002. Epub 2022 Jun 20.
8
Prediction of daily new COVID-19 cases - Difficulties and possible solutions.预测每日新增 COVID-19 病例——难点及可能的解决方案。
PLoS One. 2024 Aug 23;19(8):e0307092. doi: 10.1371/journal.pone.0307092. eCollection 2024.
9
A multi-stage SEIR(D) model of the COVID-19 epidemic in Korea.韩国 COVID-19 疫情的多阶段 SEIR(D)模型。
Ann Med. 2021 Dec;53(1):1159-1169. doi: 10.1080/07853890.2021.1949490.
10
Analysis and prediction of improved SEIR transmission dynamics model: taking the second outbreak of COVID-19 in Italy as an example.改进的 SEIR 传播动力学模型分析与预测:以意大利第二次 COVID-19 疫情爆发为例。
Front Public Health. 2023 Aug 24;11:1223039. doi: 10.3389/fpubh.2023.1223039. eCollection 2023.

引用本文的文献

1
Systematic Comparison of Different Compartmental Models for Predicting COVID-19 Progression.用于预测COVID-19病情进展的不同房室模型的系统比较
Epidemiologia (Basel). 2025 Jul 8;6(3):33. doi: 10.3390/epidemiologia6030033.
2
Study on the impact of COVID-19 epidemic and agent disease risk simulation model based on individual factors in Xi'an City.基于个体因素的西安市新冠肺炎疫情影响及 Agent 疾病风险模拟模型研究
Front Cell Infect Microbiol. 2025 May 13;15:1547601. doi: 10.3389/fcimb.2025.1547601. eCollection 2025.
3
Spatial Interaction Analysis of Infectious Disease Import and Export between Regions.

本文引用的文献

1
SEIR modeling of the COVID-19 and its dynamics.COVID-19的SEIR模型及其动态变化
Nonlinear Dyn. 2020;101(3):1667-1680. doi: 10.1007/s11071-020-05743-y. Epub 2020 Jun 18.
2
Forecasting of COVID19 per regions using ARIMA models and polynomial functions.使用自回归积分移动平均(ARIMA)模型和多项式函数对各地区的新型冠状病毒肺炎(COVID-19)进行预测。
Appl Soft Comput. 2020 Nov;96:106610. doi: 10.1016/j.asoc.2020.106610. Epub 2020 Aug 6.
3
Rapid Adaptation of Breast Radiation Therapy Use During the Coronavirus Disease 2019 Pandemic at a Large Academic Cancer Center in Canada.
区域间传染病进出口的空间交互分析。
Int J Environ Res Public Health. 2024 May 18;21(5):643. doi: 10.3390/ijerph21050643.
4
Deep learning in public health: Comparative predictive models for COVID-19 case forecasting.深度学习在公共卫生领域的应用:用于 COVID-19 病例预测的比较预测模型。
PLoS One. 2024 Mar 14;19(3):e0294289. doi: 10.1371/journal.pone.0294289. eCollection 2024.
5
Sources, diffusion and prediction in COVID-19 pandemic: lessons learned to face next health emergency.新冠疫情中的信息源、传播与预测:应对下一次卫生紧急事件的经验教训
AIMS Public Health. 2023 Mar 2;10(1):145-168. doi: 10.3934/publichealth.2023012. eCollection 2023.
6
Discrete Models in Epidemiology: New Contagion Probability Functions Based on Real Data Behavior.流行病学中的离散模型:基于真实数据行为的新传染概率函数。
Bull Math Biol. 2022 Sep 22;84(11):127. doi: 10.1007/s11538-022-01076-6.
7
Long-term spatial and population-structured planning of non-pharmaceutical interventions to epidemic outbreaks.针对疫情爆发的非药物干预措施的长期空间和人口结构规划。
Comput Oper Res. 2022 Oct;146:105919. doi: 10.1016/j.cor.2022.105919. Epub 2022 Jun 17.
8
Forecasting and modeling of the COVID-19 pandemic in the USA with a timed intervention model.基于定时干预模型对美国 COVID-19 大流行的预测和建模。
Sci Rep. 2022 Mar 14;12(1):4339. doi: 10.1038/s41598-022-07487-8.
9
From SIR to SEAIRD: A novel data-driven modeling approach based on the Grey-box System Theory to predict the dynamics of COVID-19.从SIR到SEAIRD:一种基于灰箱系统理论的新型数据驱动建模方法,用于预测新冠疫情动态。
Appl Intell (Dordr). 2022;52(1):71-80. doi: 10.1007/s10489-021-02379-2. Epub 2021 Apr 23.
10
How limitations in energy access, poverty, and socioeconomic disparities compromise health interventions for outbreaks in urban settings.能源获取方面的限制、贫困以及社会经济差距如何损害城市环境中针对疫情的卫生干预措施。
iScience. 2021 Dec 17;24(12):103389. doi: 10.1016/j.isci.2021.103389. Epub 2021 Nov 1.
加拿大一家大型学术癌症中心在2019年冠状病毒病大流行期间乳腺癌放射治疗使用情况的快速调整
Adv Radiat Oncol. 2020 Jun 19;5(4):749-756. doi: 10.1016/j.adro.2020.06.002. eCollection 2020 Jul-Aug.
4
Measurement of airborne particle exposure during simulated tracheal intubation using various proposed aerosol containment devices during the COVID-19 pandemic.在 COVID-19 大流行期间,使用各种拟议的气溶胶容器设备模拟气管插管时,测量空气中颗粒暴露情况。
Anaesthesia. 2020 Dec;75(12):1587-1595. doi: 10.1111/anae.15188. Epub 2020 Jul 9.
5
Propagation, Inactivation, and Safety Testing of SARS-CoV-2.SARS-CoV-2 的传播、灭活和安全性测试。
Viruses. 2020 Jun 6;12(6):622. doi: 10.3390/v12060622.
6
Markers of liver injury and clinical outcomes in COVID-19 patients: A systematic review and meta-analysis.新冠病毒肺炎患者肝损伤标志物与临床结局:一项系统评价与荟萃分析
J Infect. 2021 Jan;82(1):159-198. doi: 10.1016/j.jinf.2020.05.045. Epub 2020 May 28.
7
Characteristics of inflammatory factors and lymphocyte subsets in patients with severe COVID-19.严重 COVID-19 患者炎症因子和淋巴细胞亚群特征。
J Med Virol. 2020 Nov;92(11):2600-2606. doi: 10.1002/jmv.26070. Epub 2020 Jun 9.
8
Challenges and countermeasures of thoracic oncology in the epidemic of COVID-19.新型冠状病毒肺炎疫情下胸部肿瘤学面临的挑战与对策
Transl Lung Cancer Res. 2020 Apr;9(2):337-347. doi: 10.21037/tlcr.2020.02.10.
9
What policy makers need to know about COVID-19 protective immunity.政策制定者需要了解的关于新冠病毒保护性免疫的信息。
Lancet. 2020 May 16;395(10236):1527-1529. doi: 10.1016/S0140-6736(20)30985-5. Epub 2020 Apr 27.
10
The role of neutrophil death in chronic inflammation and cancer.中性粒细胞死亡在慢性炎症和癌症中的作用。
Cell Death Discov. 2020 Apr 22;6:26. doi: 10.1038/s41420-020-0255-6. eCollection 2020.