• 文献检索
  • 文档翻译
  • 深度研究
  • 学术资讯
  • Suppr Zotero 插件Zotero 插件
  • 邀请有礼
  • 套餐&价格
  • 历史记录
应用&插件
Suppr Zotero 插件Zotero 插件浏览器插件Mac 客户端Windows 客户端微信小程序
定价
高级版会员购买积分包购买API积分包
服务
文献检索文档翻译深度研究API 文档MCP 服务
关于我们
关于 Suppr公司介绍联系我们用户协议隐私条款
关注我们

Suppr 超能文献

核心技术专利:CN118964589B侵权必究
粤ICP备2023148730 号-1Suppr @ 2026

文献检索

告别复杂PubMed语法,用中文像聊天一样搜索,搜遍4000万医学文献。AI智能推荐,让科研检索更轻松。

立即免费搜索

文件翻译

保留排版,准确专业,支持PDF/Word/PPT等文件格式,支持 12+语言互译。

免费翻译文档

深度研究

AI帮你快速写综述,25分钟生成高质量综述,智能提取关键信息,辅助科研写作。

立即免费体验

中国八大经济区域碳排放差异分解及空间异质性格局研究

Research on carbon emission differences decomposition and spatial heterogeneity pattern of China's eight economic regions.

作者信息

Zhang Yuan, Yu Zhen, Zhang Juan

机构信息

School of Management, China University of Mining & Technology (Beijing), Beijing, China.

State Key Laboratory of Precision Measuring Technology and Instrument, Tianjin University, Tianjin, China.

出版信息

Environ Sci Pollut Res Int. 2022 Apr;29(20):29976-29992. doi: 10.1007/s11356-021-17935-z. Epub 2022 Jan 8.

DOI:10.1007/s11356-021-17935-z
PMID:34997485
原文链接:https://pmc.ncbi.nlm.nih.gov/articles/PMC8741551/
Abstract

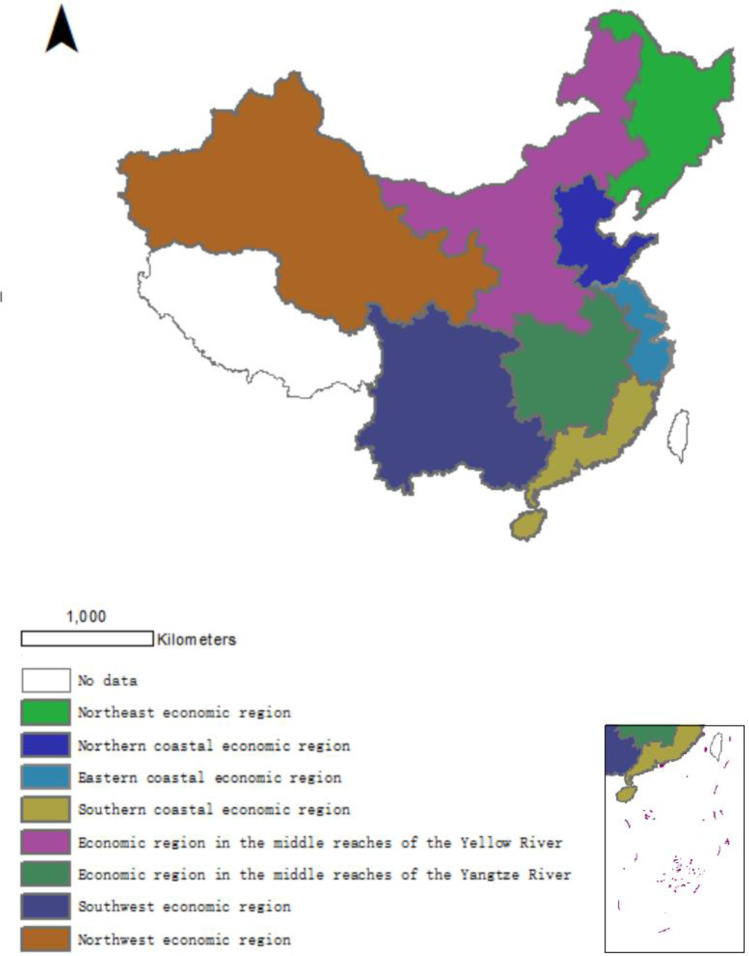
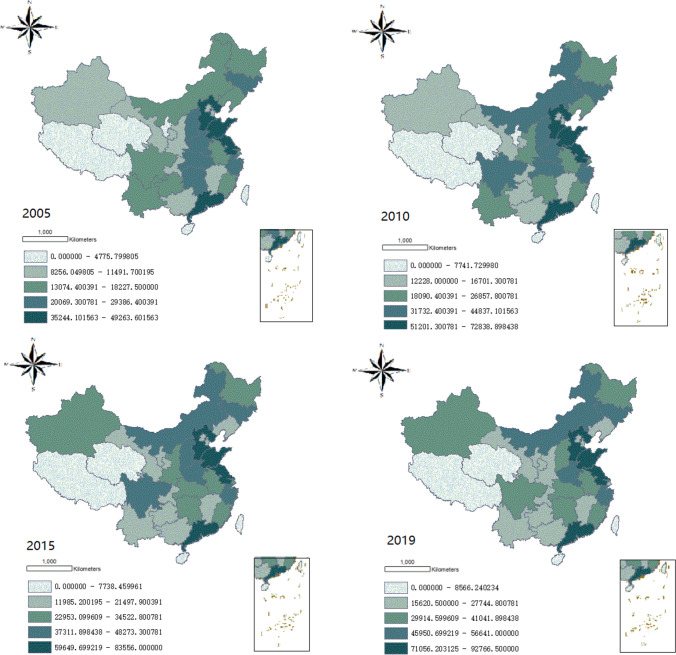
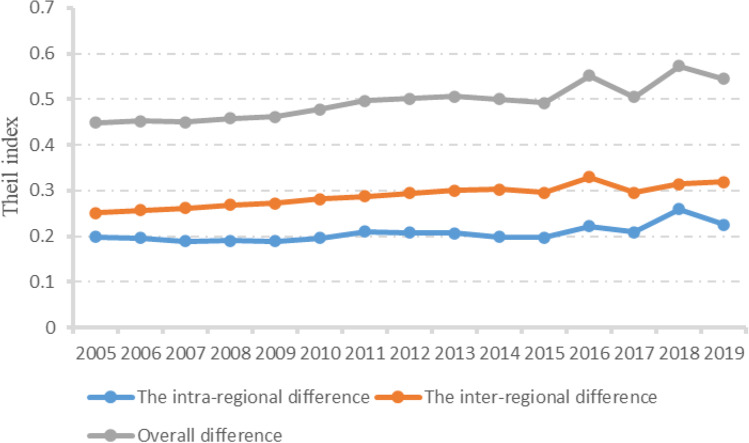
To explore the sources of regional carbon emission differences and the evolution characteristics of spatial heterogeneity pattern, this paper first calculates the corresponding carbon emissions according to the relevant statistical data of eight economic regions in China from 2005 to 2019. It analyzes the overall differences and temporal and spatial evolution characteristics of regional carbon emissions combined with the visualization method of GIS. Then, the total carbon emission difference is decomposed by the Theil index to find out the primary sources affecting the regional carbon emission difference. Finally, the driving factors affecting the spatial heterogeneity pattern of regional carbon emissions are studied with the help of the Geodetector method. The results show that (1) significant differences in carbon emissions among China's eight economic regions. The contribution rate of inter-regional and intra-regional differences of carbon emissions in different regions to the overall carbon emission difference is diverse. (2) Regional carbon emissions are affected by single driving factors and the interaction of two driving factors. The interaction has an increasing impact on the determinant of regional carbon emission spatial differentiation. (3) The factor detection results and interaction detection results, respectively, show that the level of energy consumption, industrialization, and technological development has always been the main driving factors affecting the spatial heterogeneity pattern of regional carbon emissions, and the critical interaction factors have multiple spatial superposition interaction effects. Therefore, regional carbon emission reduction should consider the national strategic objectives and own regional characteristics and implement differentiated emission reduction schemes.

摘要

为探究区域碳排放差异的来源及空间异质性格局的演变特征,本文首先根据2005—2019年中国八大经济区域的相关统计数据计算相应的碳排放量,结合GIS可视化方法分析区域碳排放的总体差异及时空演变特征;然后利用泰尔指数对碳排放总量差异进行分解,找出影响区域碳排放差异的主要来源;最后借助地理探测器方法研究影响区域碳排放空间异质性格局的驱动因素。结果表明:(1)中国八大经济区域间碳排放存在显著差异,不同区域碳排放的区域间差异和区域内差异对总体碳排放差异的贡献率各不相同;(2)区域碳排放受单一驱动因素及两个驱动因素交互作用的影响,交互作用对区域碳排放空间分异的决定性作用不断增强;(3)因子探测结果和交互探测结果分别表明,能源消耗水平、工业化水平和技术发展水平一直是影响区域碳排放空间异质性格局的主要驱动因素,关键交互作用因素具有多种空间叠加交互效应。因此,区域碳排放减排应兼顾国家战略目标和自身区域特点,实施差异化减排方案。

https://cdn.ncbi.nlm.nih.gov/pmc/blobs/b6b4/8741551/a6d68e25bc55/11356_2021_17935_Fig5_HTML.jpg
https://cdn.ncbi.nlm.nih.gov/pmc/blobs/b6b4/8741551/24f13e7c3a67/11356_2021_17935_Fig1_HTML.jpg
https://cdn.ncbi.nlm.nih.gov/pmc/blobs/b6b4/8741551/93f4200c8adc/11356_2021_17935_Fig2_HTML.jpg
https://cdn.ncbi.nlm.nih.gov/pmc/blobs/b6b4/8741551/c8bfad8c3ecf/11356_2021_17935_Fig3_HTML.jpg
https://cdn.ncbi.nlm.nih.gov/pmc/blobs/b6b4/8741551/5f14a83b7ffc/11356_2021_17935_Fig4_HTML.jpg
https://cdn.ncbi.nlm.nih.gov/pmc/blobs/b6b4/8741551/a6d68e25bc55/11356_2021_17935_Fig5_HTML.jpg

相似文献

1
Research on carbon emission differences decomposition and spatial heterogeneity pattern of China's eight economic regions.中国八大经济区域碳排放差异分解及空间异质性格局研究
Environ Sci Pollut Res Int. 2022 Apr;29(20):29976-29992. doi: 10.1007/s11356-021-17935-z. Epub 2022 Jan 8.
2
Driving factors of spatial-temporal difference in China's transportation sector carbon productivity: an empirical analysis based on Geodetector method.中国交通运输部门碳生产率时空差异的驱动因素:基于地理探测器方法的实证分析。
Environ Sci Pollut Res Int. 2023 Mar;30(11):30656-30671. doi: 10.1007/s11356-022-24008-2. Epub 2022 Nov 28.
3
Analysis and prediction of the temporal and spatial evolution of carbon emissions in China's eight economic regions.中国八大经济区碳排放的时空演变分析与预测。
PLoS One. 2022 Dec 1;17(12):e0277906. doi: 10.1371/journal.pone.0277906. eCollection 2022.
4
Carbon emissions' spatial-temporal heterogeneity and identification from rural energy consumption in China.中国农村能源消费碳排放的时空异质性及其识别。
J Environ Manage. 2022 Feb 15;304:114286. doi: 10.1016/j.jenvman.2021.114286. Epub 2021 Dec 13.
5
Analysis of carbon emission performance and regional differences in China's eight economic regions: Based on the super-efficiency SBM model and the Theil index.中国八大经济区域碳排放绩效及区域差异分析:基于超效率 SBM 模型和泰尔指数。
PLoS One. 2021 May 5;16(5):e0250994. doi: 10.1371/journal.pone.0250994. eCollection 2021.
6
Analysis of China's carbon emission driving factors based on the perspective of eight major economic regions.基于八大经济区域视角的中国碳排放驱动因素分析。
Environ Sci Pollut Res Int. 2021 Feb;28(7):8181-8204. doi: 10.1007/s11356-020-11044-z. Epub 2020 Oct 14.
7
Characteristics, decoupling effect, and driving factors of regional tourism's carbon emissions in China.中国区域旅游碳排放的特征、脱钩效应及驱动因素。
Environ Sci Pollut Res Int. 2022 Jul;29(31):47082-47093. doi: 10.1007/s11356-022-19054-9. Epub 2022 Feb 17.
8
Decomposition of China's regional carbon emission paths: an analysis of environmental input and output considering regional development differences.中国区域碳排放路径的分解:考虑区域发展差异的环境投入产出分析。
Environ Sci Pollut Res Int. 2022 Sep;29(41):62537-62559. doi: 10.1007/s11356-022-19896-3. Epub 2022 Apr 11.
9
Feasibility of peaking carbon emissions of the power sector in China's eight regions: decomposition, decoupling, and prediction analysis.中国八个区域电力部门碳排放峰值的可行性:分解、脱钩和预测分析。
Environ Sci Pollut Res Int. 2019 Oct;26(28):29212-29233. doi: 10.1007/s11356-019-05909-1. Epub 2019 Aug 8.
10
On the driving factors of China's provincial carbon emission from the view of periods and groups.从时期和群体角度看中国省级碳排放的驱动因素。
Environ Sci Pollut Res Int. 2021 Oct;28(37):51971-51988. doi: 10.1007/s11356-021-14268-9. Epub 2021 May 16.

引用本文的文献

1
Spatial and temporal evolution characteristics of apple carbon emissions in China, 1991-2020.1991 - 2020年中国苹果碳排放的时空演变特征
Sci Rep. 2025 May 27;15(1):18478. doi: 10.1038/s41598-025-02419-8.
2
Spatio-temporal differentiation characteristics of coal mine safety levels in China based on spatial spillover effects.基于空间溢出效应的中国煤矿安全水平时空分异特征
Heliyon. 2024 Sep 20;10(19):e37841. doi: 10.1016/j.heliyon.2024.e37841. eCollection 2024 Oct 15.
3
Spatial and socioeconomic characteristics of CO emissions and sequestration in Indonesian cities.

本文引用的文献

1
Energy structure, digital economy, and carbon emissions: evidence from China.能源结构、数字经济与碳排放:来自中国的证据。
Environ Sci Pollut Res Int. 2021 Dec;28(45):64606-64629. doi: 10.1007/s11356-021-15304-4. Epub 2021 Jul 27.
2
The drivers of energy-related CO emissions in Brazil: a regional application of the STIRPAT model.巴西能源相关 CO 排放的驱动因素:STIRPAT 模型的区域应用。
Environ Sci Pollut Res Int. 2021 Oct;28(37):51745-51762. doi: 10.1007/s11356-021-14097-w. Epub 2021 May 15.
3
Analysis of carbon emission performance and regional differences in China's eight economic regions: Based on the super-efficiency SBM model and the Theil index.
印度尼西亚城市一氧化碳排放与封存的空间及社会经济特征。
Heliyon. 2023 Nov 7;9(11):e22000. doi: 10.1016/j.heliyon.2023.e22000. eCollection 2023 Nov.
4
Decoupling between Economic Growth and Carbon Emissions: Based on Four Major Regions in China.经济增长与碳排放脱钩:基于中国四大地区。
Int J Environ Res Public Health. 2023 Jan 13;20(2):1496. doi: 10.3390/ijerph20021496.
5
Carbon emission quota allocation of high energy consumption industries in undeveloped areas - A case study of Inner Mongolia Autonomous Region.欠发达地区高耗能行业碳排放配额分配——以内蒙古自治区为例
Heliyon. 2022 Oct 27;8(11):e11241. doi: 10.1016/j.heliyon.2022.e11241. eCollection 2022 Nov.
6
Analysis of Dynamic Evolution and Spatial-Temporal Heterogeneity of Carbon Emissions at County Level along "The Belt and Road"-A Case Study of Northwest China.沿“一带一路”县级碳排放动态演变与时空异质性分析——以中国西北地区为例。
Int J Environ Res Public Health. 2022 Oct 17;19(20):13405. doi: 10.3390/ijerph192013405.
中国八大经济区域碳排放绩效及区域差异分析:基于超效率 SBM 模型和泰尔指数。
PLoS One. 2021 May 5;16(5):e0250994. doi: 10.1371/journal.pone.0250994. eCollection 2021.
4
Accounting for all territorial emissions and sinks is important for development of climate mitigation policies.考虑到所有区域的排放和汇对于制定气候缓解政策至关重要。
Carbon Balance Manag. 2021 Apr 10;16(1):10. doi: 10.1186/s13021-021-00173-8.
5
Regional difference decomposition and its spatiotemporal dynamic evolution of Chinese agricultural carbon emission: considering carbon sink effect.中国农业碳排放的区域差异分解及其时空动态演进:考虑碳汇效应。
Environ Sci Pollut Res Int. 2021 Aug;28(29):38909-38928. doi: 10.1007/s11356-021-13442-3. Epub 2021 Mar 20.
6
Dynamic Relationships, Regional Differences, and Driving Mechanisms between Economic Development and Carbon Emissions from the Farming Industry: Empirical Evidence from Rural China.动态关系、区域差异与农业碳排放的经济发展驱动机制——来自中国农村的实证证据。
Int J Environ Res Public Health. 2021 Feb 25;18(5):2257. doi: 10.3390/ijerph18052257.
7
How China could be carbon neutral by mid-century.中国如何在本世纪中叶实现碳中和。
Nature. 2020 Oct;586(7830):482-483. doi: 10.1038/d41586-020-02927-9.
8
Analysis of China's carbon emission driving factors based on the perspective of eight major economic regions.基于八大经济区域视角的中国碳排放驱动因素分析。
Environ Sci Pollut Res Int. 2021 Feb;28(7):8181-8204. doi: 10.1007/s11356-020-11044-z. Epub 2020 Oct 14.
9
The effects of environmental regulation and industrial structure on carbon dioxide emission: a non-linear investigation.环境规制和产业结构对二氧化碳排放的影响:非线性研究。
Environ Sci Pollut Res Int. 2019 Oct;26(29):30252-30267. doi: 10.1007/s11356-019-06150-6. Epub 2019 Aug 19.
10
Carbon emission intensity of electricity generation in Belt and Road Initiative countries: a benchmarking analysis.“一带一路”倡议国家发电碳排放强度:基准分析。
Environ Sci Pollut Res Int. 2019 May;26(15):15057-15068. doi: 10.1007/s11356-019-04860-5. Epub 2019 Mar 27.