Yao Hongyan, Wu Shanjun, Zhan Zongyi, Li Zijing
Ningbo Eye Hospital, Ningbo University, Ningbo 315000, China.
Department of Ophthalmology, Sun Yat-Sen Memorial Hospital, Sun Yat-sen University, Guangzhou 510020, China.
J Ophthalmol. 2022 Feb 15;2022:9681034. doi: 10.1155/2022/9681034. eCollection 2022.
To establish a classification tree model in DR screening and to compare the DR screening accuracy between the classification tree model and the logistic regression model in type 2 diabetes mellitus (T2DM) patients based on OCTA variables.
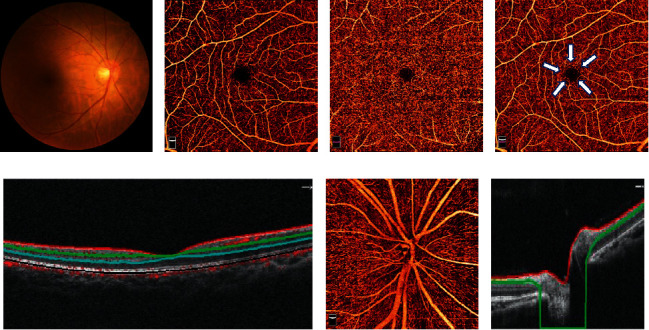
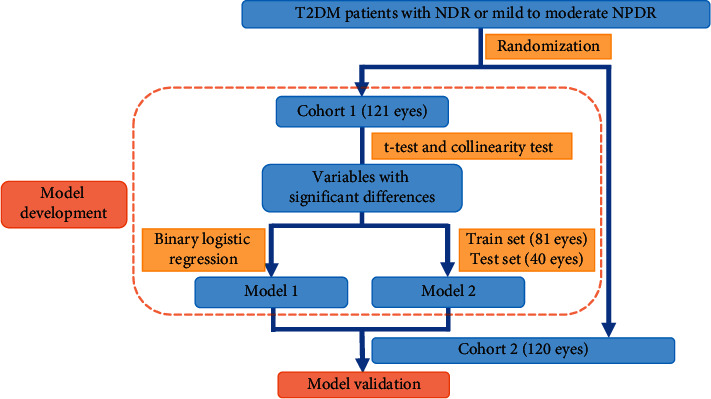
Two hundred forty-one eyes of 241 T2DM patients were included and divided into two groups: the development cohort and the validation cohort. Optical coherence tomography angiography (OCTA) images were acquired in these patients. The data of foveal avascular zone area, superficial capillary plexus (SCP) density, and deep capillary plexus (DCP) density were exported after automatically analyzing the macular 6 × 6 mm OCTA images, while the data of radial peripapillary capillary plexus (RPCP) density was exported after automatically analyzing the optic nerve head 4.5 × 4.5 mm OCTA images. These OCTA variables were adopted to establish and validate the logistic regression model and the classification tree model. The area under the curve (AUC), sensitivity, specificity, and statistical power for receiver operating characteristic curves of two models were calculated.
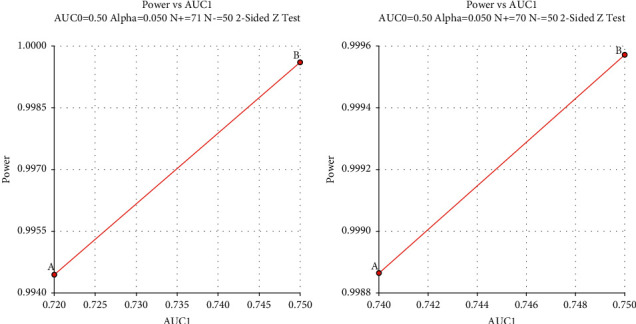
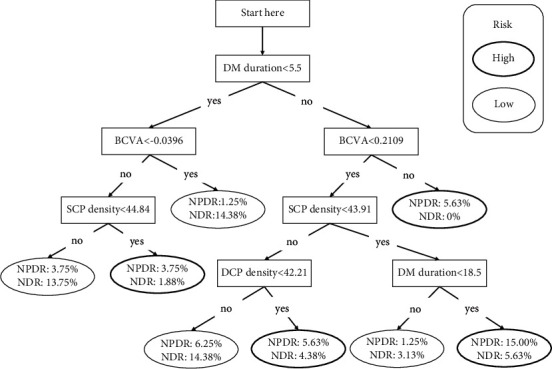
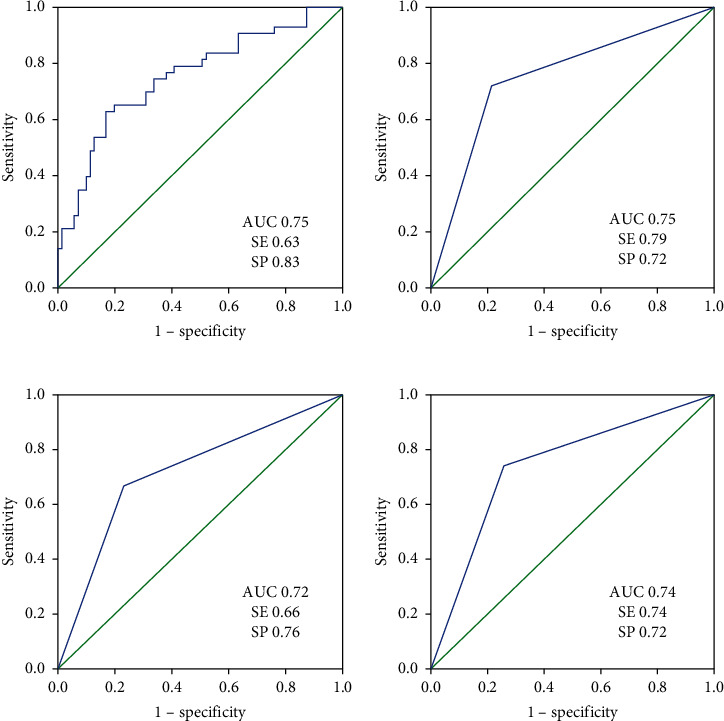
In the logistic regression model, best-corrected visual acuity (BCVA) (LogMAR) and SCP density were entered (BVCA : OR= 60.30, 95% CI= [2.40, 1513.82], = 0.013; SCP density: OR= 0.86, 95% CI= [0.78, 0.96], = 0.006). The AUC, sensitivity, and specificity for detecting early-stage DR (mild to moderate NPDR) in the development cohort were 0.75 (95% CI: [0.66, 0.85]), 63%, and 83%, respectively. The AUC, sensitivity, and specificity in the validation cohort were 0.75 (95% CI: [0.66, 0.84]), 79%, and 72%, respectively. In the classification tree model, BVCA (LogMAR), DM duration, SCP density, and DCP density were entered. The AUC, sensitivity, and specificity for detecting early-stage DR were 0.72 (95% CI: [0.60, 0.84]), 66%, and 76%, respectively. The AUC, sensitivity, and specificity in the validation cohort were 0.74 (95% CI: [0.65, 0.83]), 74%, and 72%, respectively. The statistical power of the development and validation cohorts in two models was all more than 99%.
Compared to the logistic regression model, the classification tree model has similar accuracy in predicting early-stage DR. The classification tree model with OCTA variables may be a simple tool for clinical practitioners to identify early-stage DR in T2DM patients. Moreover, SCP density is significantly reduced in mild-to-moderate NPDR eyes and might be a biomarker in early-stage DR detection. Further improvement and validation of the DR diagnostic model are awaiting to be performed.
建立糖尿病视网膜病变(DR)筛查的分类树模型,并基于光学相干断层扫描血管造影(OCTA)变量比较分类树模型与逻辑回归模型在2型糖尿病(T2DM)患者中的DR筛查准确性。
纳入241例T2DM患者的241只眼,分为两组:开发队列和验证队列。对这些患者进行光学相干断层扫描血管造影(OCTA)成像。自动分析黄斑6×6mm OCTA图像后导出中心凹无血管区面积、浅表毛细血管丛(SCP)密度和深层毛细血管丛(DCP)密度数据,自动分析视神经乳头4.5×4.5mm OCTA图像后导出放射状视乳头周围毛细血管丛(RPCP)密度数据。采用这些OCTA变量建立并验证逻辑回归模型和分类树模型。计算两个模型的受试者操作特征曲线的曲线下面积(AUC)、敏感性、特异性和统计效能。
在逻辑回归模型中,纳入了最佳矫正视力(BCVA)(LogMAR)和SCP密度(BCVA:OR = 60.30,95%CI = [2.40, 1513.82],P = 0.013;SCP密度:OR = 0.86,95%CI = [0.78, 0.96],P = 0.006)。开发队列中检测早期DR(轻度至中度非增殖性糖尿病视网膜病变)的AUC、敏感性和特异性分别为0.75(95%CI:[0.66, 0.85])、63%和