• 文献检索
  • 文档翻译
  • 深度研究
  • 学术资讯
  • Suppr Zotero 插件Zotero 插件
  • 邀请有礼
  • 套餐&价格
  • 历史记录
应用&插件
Suppr Zotero 插件Zotero 插件浏览器插件Mac 客户端Windows 客户端微信小程序
定价
高级版会员购买积分包购买API积分包
服务
文献检索文档翻译深度研究API 文档MCP 服务
关于我们
关于 Suppr公司介绍联系我们用户协议隐私条款
关注我们

Suppr 超能文献

核心技术专利:CN118964589B侵权必究
粤ICP备2023148730 号-1Suppr @ 2026

文献检索

告别复杂PubMed语法,用中文像聊天一样搜索,搜遍4000万医学文献。AI智能推荐,让科研检索更轻松。

立即免费搜索

文件翻译

保留排版,准确专业,支持PDF/Word/PPT等文件格式,支持 12+语言互译。

免费翻译文档

深度研究

AI帮你快速写综述,25分钟生成高质量综述,智能提取关键信息,辅助科研写作。

立即免费体验

DGCyTOF:基于图形聚类可视化的深度学习,用于预测单细胞质谱流式细胞术数据的细胞类型。

DGCyTOF: Deep learning with graphic cluster visualization to predict cell types of single cell mass cytometry data.

机构信息

Department of Biomedical Informatics, College of Medicine, The Ohio State University, Columbus, Ohio, United States of America.

The Grainger College of Engineering, The University of Illinois Urbana-Champaign, Urbana and Champaign, Champaign, Illinois, United States of America.

出版信息

PLoS Comput Biol. 2022 Apr 11;18(4):e1008885. doi: 10.1371/journal.pcbi.1008885. eCollection 2022 Apr.

DOI:10.1371/journal.pcbi.1008885
PMID:35404970
原文链接:https://pmc.ncbi.nlm.nih.gov/articles/PMC9060369/
Abstract

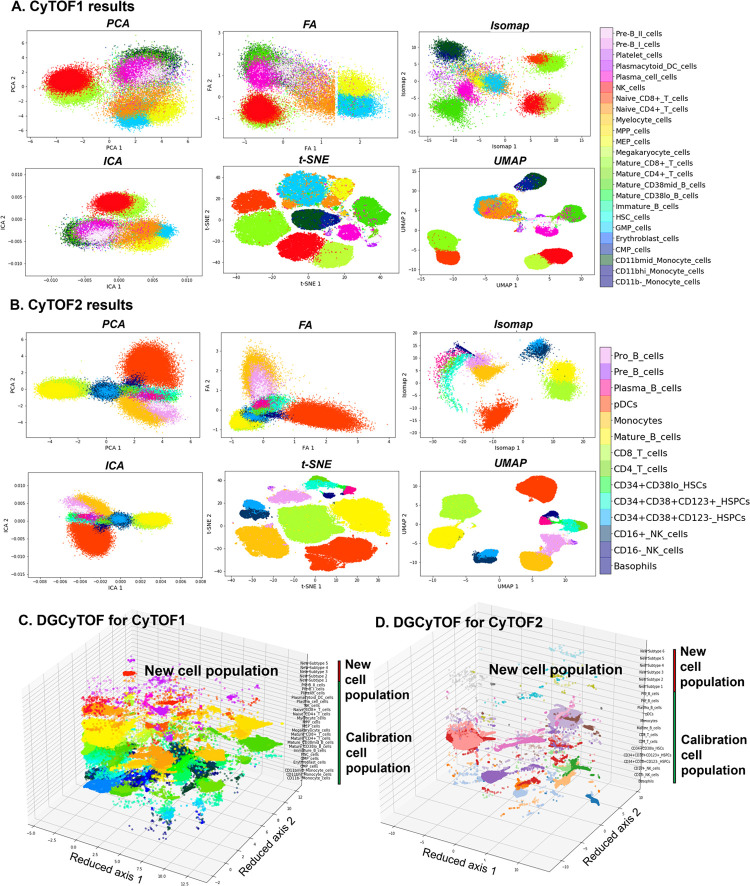
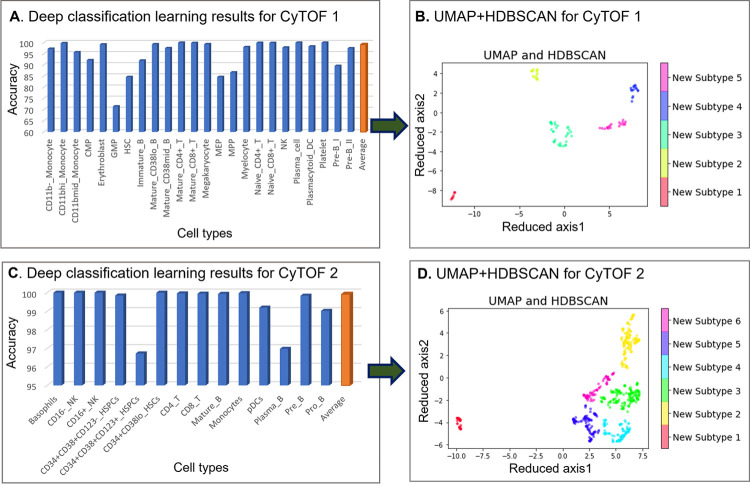
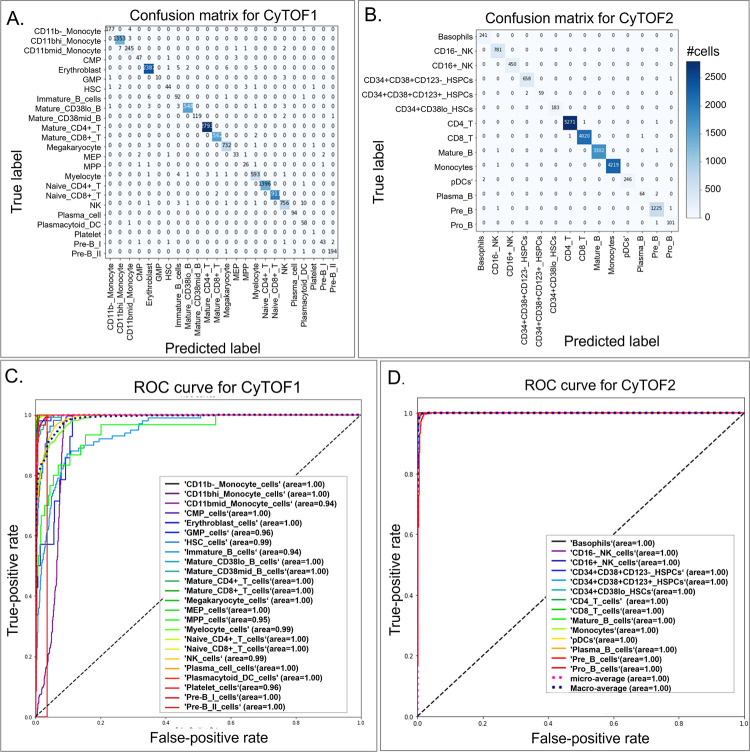
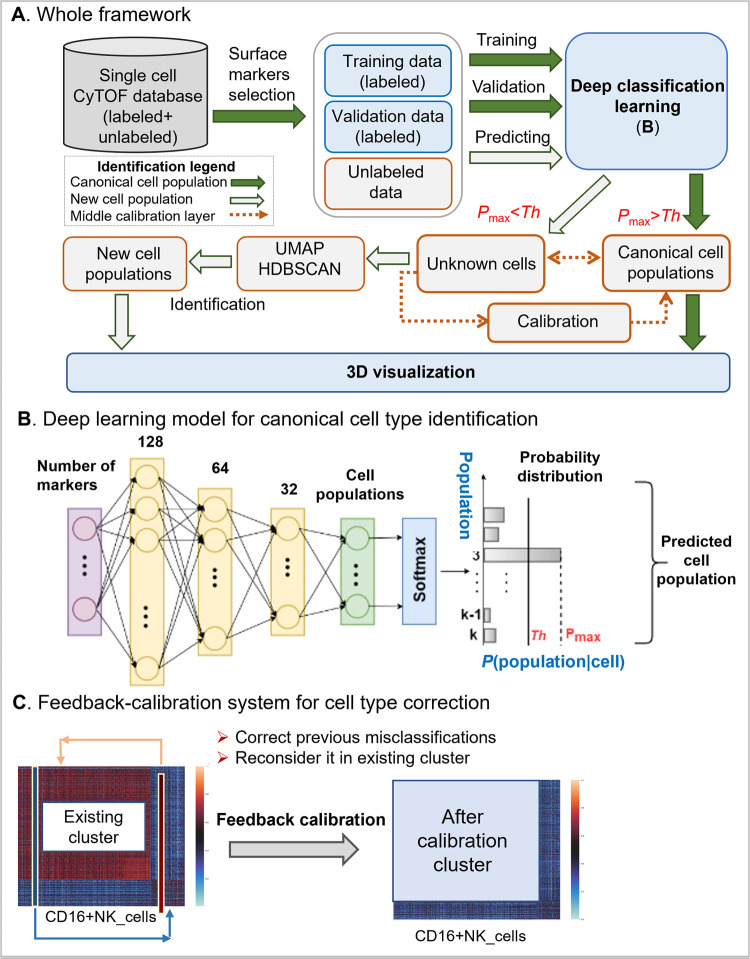
Single-cell mass cytometry, also known as cytometry by time of flight (CyTOF) is a powerful high-throughput technology that allows analysis of up to 50 protein markers per cell for the quantification and classification of single cells. Traditional manual gating utilized to identify new cell populations has been inadequate, inefficient, unreliable, and difficult to use, and no algorithms to identify both calibration and new cell populations has been well established. A deep learning with graphic cluster (DGCyTOF) visualization is developed as a new integrated embedding visualization approach in identifying canonical and new cell types. The DGCyTOF combines deep-learning classification and hierarchical stable-clustering methods to sequentially build a tri-layer construct for known cell types and the identification of new cell types. First, deep classification learning is constructed to distinguish calibration cell populations from all cells by softmax classification assignment under a probability threshold, and graph embedding clustering is then used to identify new cell populations sequentially. In the middle of two-layer, cell labels are automatically adjusted between new and unknown cell populations via a feedback loop using an iteration calibration system to reduce the rate of error in the identification of cell types, and a 3-dimensional (3D) visualization platform is finally developed to display the cell clusters with all cell-population types annotated. Utilizing two benchmark CyTOF databases comprising up to 43 million cells, we compared accuracy and speed in the identification of cell types among DGCyTOF, DeepCyTOF, and other technologies including dimension reduction with clustering, including Principal Component Analysis (PCA), Factor Analysis (FA), Independent Component Analysis (ICA), Isometric Feature Mapping (Isomap), t-distributed Stochastic Neighbor Embedding (t-SNE), and Uniform Manifold Approximation and Projection (UMAP) with k-means clustering and Gaussian mixture clustering. We observed the DGCyTOF represents a robust complete learning system with high accuracy, speed and visualization by eight measurement criteria. The DGCyTOF displayed F-scores of 0.9921 for CyTOF1 and 0.9992 for CyTOF2 datasets, whereas those scores were only 0.507 and 0.529 for the t-SNE+k-means; 0.565 and 0.59, for UMAP+ k-means. Comparison of DGCyTOF with t-SNE and UMAP visualization in accuracy demonstrated its approximately 35% superiority in predicting cell types. In addition, observation of cell-population distribution was more intuitive in the 3D visualization in DGCyTOF than t-SNE and UMAP visualization. The DGCyTOF model can automatically assign known labels to single cells with high accuracy using deep-learning classification assembling with traditional graph-clustering and dimension-reduction strategies. Guided by a calibration system, the model seeks optimal accuracy balance among calibration cell populations and unknown cell types, yielding a complete and robust learning system that is highly accurate in the identification of cell populations compared to results using other methods in the analysis of single-cell CyTOF data. Application of the DGCyTOF method to identify cell populations could be extended to the analysis of single-cell RNASeq data and other omics data.

https://cdn.ncbi.nlm.nih.gov/pmc/blobs/fa10/9060369/9159a4a82fe1/pcbi.1008885.g004.jpg
https://cdn.ncbi.nlm.nih.gov/pmc/blobs/fa10/9060369/a70aa2e4181b/pcbi.1008885.g001.jpg
https://cdn.ncbi.nlm.nih.gov/pmc/blobs/fa10/9060369/0b01622b8eb2/pcbi.1008885.g002.jpg
https://cdn.ncbi.nlm.nih.gov/pmc/blobs/fa10/9060369/fd236f8ddd54/pcbi.1008885.g003.jpg
https://cdn.ncbi.nlm.nih.gov/pmc/blobs/fa10/9060369/9159a4a82fe1/pcbi.1008885.g004.jpg
摘要

单细胞质量细胞术,也称为飞行时间细胞术(CyTOF),是一种强大的高通量技术,允许对每个细胞进行多达 50 个蛋白质标记物的定量和分类,以用于单细胞的分析。传统的手动门控技术用于识别新的细胞群已经不够用、效率低下、不可靠且难以使用,并且还没有建立用于识别校准和新细胞群的算法。一种新的集成嵌入可视化方法——基于图形聚类的深度学习(DGCyTOF)可视化,已被开发用于识别经典和新型细胞类型。DGCyTOF 将深度学习分类和层次稳定聚类方法结合起来,为已知细胞类型和新细胞类型的识别顺序构建一个三层结构。首先,通过软最大分类分配在概率阈值下,构建深度分类学习,以区分校准细胞群体与所有细胞,并通过图嵌入聚类顺序识别新的细胞群体。在两层中间,通过使用迭代校准系统的反馈循环,自动调整新和未知细胞群体之间的细胞标签,以降低细胞类型识别中的错误率,最后开发了一个 3D 可视化平台,用于显示带有所有细胞群体类型注释的细胞群。利用包含多达 4300 万个细胞的两个基准 CyTOF 数据库,我们比较了 DGCyTOF、DeepCyTOF 和其他技术(包括聚类的降维和主成分分析(PCA)、因子分析(FA)、独立成分分析(ICA)、等距特征映射(Isomap)、t 分布随机邻居嵌入(t-SNE)和均方根逼近和投影(UMAP)与 k-means 聚类和高斯混合聚类)在细胞类型识别中的准确性和速度。我们观察到 DGCyTOF 代表了一个具有高准确性、速度和可视化的强大完整学习系统,具有八个测量标准。DGCyTOF 对 CyTOF1 和 CyTOF2 数据集的 F 分数分别为 0.9921 和 0.9992,而 t-SNE+k-means 的分数仅为 0.507 和 0.529;UMAP+k-means 的分数分别为 0.565 和 0.59。在准确性方面,DGCyTOF 与 t-SNE 和 UMAP 可视化的比较表明,它在预测细胞类型方面的优势约为 35%。此外,与 t-SNE 和 UMAP 可视化相比,在 DGCyTOF 中的 3D 可视化中,细胞群体分布的观察更加直观。DGCyTOF 模型可以使用深度学习分类与传统的图聚类和降维策略相结合,高精度地自动为单个细胞分配已知标签。在一个校准系统的指导下,该模型在校准细胞群体和未知细胞类型之间寻求最佳的准确性平衡,产生了一个完整和强大的学习系统,与其他方法相比,在单细胞 CyTOF 数据分析中,该系统在细胞群体识别方面具有更高的准确性。DGCyTOF 方法用于识别细胞群体的应用可以扩展到单细胞 RNA-Seq 数据和其他组学数据的分析。

相似文献

1
DGCyTOF: Deep learning with graphic cluster visualization to predict cell types of single cell mass cytometry data.DGCyTOF:基于图形聚类可视化的深度学习,用于预测单细胞质谱流式细胞术数据的细胞类型。
PLoS Comput Biol. 2022 Apr 11;18(4):e1008885. doi: 10.1371/journal.pcbi.1008885. eCollection 2022 Apr.
2
Visualizing Single-Cell RNA-seq Data with Semisupervised Principal Component Analysis.基于半监督主成分分析的单细胞 RNA-seq 数据可视化
Int J Mol Sci. 2020 Aug 12;21(16):5797. doi: 10.3390/ijms21165797.
3
A cross entropy test allows quantitative statistical comparison of t-SNE and UMAP representations.交叉熵测试允许对 t-SNE 和 UMAP 表示进行定量统计比较。
Cell Rep Methods. 2023 Jan 13;3(1):100390. doi: 10.1016/j.crmeth.2022.100390. eCollection 2023 Jan 23.
4
Dimensionality reduction by UMAP reinforces sample heterogeneity analysis in bulk transcriptomic data.UMAP 通过降维增强了批量转录组数据中样本异质性分析。
Cell Rep. 2021 Jul 27;36(4):109442. doi: 10.1016/j.celrep.2021.109442.
5
Preprocessing of Single Cell RNA Sequencing Data Using Correlated Clustering and Projection.单细胞 RNA 测序数据的相关聚类和投影预处理。
J Chem Inf Model. 2024 Apr 8;64(7):2829-2838. doi: 10.1021/acs.jcim.3c00674. Epub 2023 Jul 4.
6
UMAP-assisted $K$-means clustering of large-scale SARS-CoV-2 mutation datasets.大规模SARS-CoV-2突变数据集的UMAP辅助K均值聚类
ArXiv. 2020 Dec 30:arXiv:2012.15268v1.
7
UMAP-assisted K-means clustering of large-scale SARS-CoV-2 mutation datasets.基于 UMAP 的 SARS-CoV-2 大规模突变数据集的 K-means 聚类分析。
Comput Biol Med. 2021 Apr;131:104264. doi: 10.1016/j.compbiomed.2021.104264. Epub 2021 Feb 22.
8
Statistical method scDEED for detecting dubious 2D single-cell embeddings and optimizing t-SNE and UMAP hyperparameters.用于检测可疑的 2D 单细胞嵌入并优化 t-SNE 和 UMAP 参数的统计方法 scDEED。
Nat Commun. 2024 Feb 26;15(1):1753. doi: 10.1038/s41467-024-45891-y.
9
Evaluation of Distance Metrics and Spatial Autocorrelation in Uniform Manifold Approximation and Projection Applied to Mass Spectrometry Imaging Data.基于均摊近似和投影的距离度量和空间自相关评估及其在质谱成像数据中的应用。
Anal Chem. 2019 May 7;91(9):5706-5714. doi: 10.1021/acs.analchem.8b05827. Epub 2019 Apr 25.
10
Supervised capacity preserving mapping: a clustering guided visualization method for scRNA-seq data.监督容量保持映射:一种基于聚类的 scRNA-seq 数据可视化方法。
Bioinformatics. 2022 Apr 28;38(9):2496-2503. doi: 10.1093/bioinformatics/btac131.

引用本文的文献

1
Automated descriptive cell type naming in flow and mass cytometry with CytoPheno.使用CytoPheno在流式细胞术和质谱细胞术中进行自动描述性细胞类型命名。
Sci Rep. 2025 Jul 23;15(1):26750. doi: 10.1038/s41598-025-12153-w.
2
Optimal transport reveals immune perturbation and fingerprints over time in COVID-19 vaccination.最优传输揭示了新冠疫苗接种过程中随时间变化的免疫扰动和特征。
Exp Biol Med (Maywood). 2025 May 21;250:10445. doi: 10.3389/ebm.2025.10445. eCollection 2025.
3
CytoPheno: Automated descriptive cell type naming in flow and mass cytometry.

本文引用的文献

1
Integration of single-cell datasets reveals novel transcriptomic signatures of β-cells in human type 2 diabetes.单细胞数据集整合揭示了人类2型糖尿病中β细胞新的转录组特征。
NAR Genom Bioinform. 2020 Nov 20;2(4):lqaa097. doi: 10.1093/nargab/lqaa097. eCollection 2020 Dec.
2
The art of using t-SNE for single-cell transcriptomics.使用 t-SNE 进行单细胞转录组学分析的艺术。
Nat Commun. 2019 Nov 28;10(1):5416. doi: 10.1038/s41467-019-13056-x.
3
Validation of CyTOF Against Flow Cytometry for Immunological Studies and Monitoring of Human Cancer Clinical Trials.
细胞表型:流式细胞术和质谱细胞术中的自动描述性细胞类型命名
bioRxiv. 2025 Mar 14:2025.03.11.639902. doi: 10.1101/2025.03.11.639902.
4
Integrated workflow for analysis of immune enriched spatial proteomic data with IMmuneCite.使用IMmuneCite分析免疫富集空间蛋白质组学数据的集成工作流程。
Sci Rep. 2025 Mar 19;15(1):9394. doi: 10.1038/s41598-025-93060-y.
5
Automated cytometric gating with human-level performance using bivariate segmentation.使用双变量分割实现具有人类水平性能的自动细胞计量门控。
Nat Commun. 2025 Feb 12;16(1):1576. doi: 10.1038/s41467-025-56622-2.
6
Cytometry masked autoencoder: An accurate and interpretable automated immunophenotyper.流式细胞术掩码自动编码器:一种准确且可解释的自动化免疫表型分析器。
Cell Rep Med. 2024 Nov 19;5(11):101808. doi: 10.1016/j.xcrm.2024.101808. Epub 2024 Nov 7.
7
ImmCellTyper facilitates systematic mass cytometry data analysis for deep immune profiling.ImmCellTyper 可促进系统的质谱细胞术数据分析,实现深度免疫剖析。
Elife. 2024 Sep 6;13:RP95494. doi: 10.7554/eLife.95494.
8
Recent Developments in Machine Learning for Mass Spectrometry.用于质谱分析的机器学习的最新进展
ACS Meas Sci Au. 2024 Feb 21;4(3):233-246. doi: 10.1021/acsmeasuresciau.3c00060. eCollection 2024 Jun 19.
9
GateMeClass: Gate Mining and Classification of cytometry data.GateMeClass:流式细胞术数据的门控挖掘和分类。
Bioinformatics. 2024 May 2;40(5). doi: 10.1093/bioinformatics/btae322.
10
Automated Cytometric Gating with Human-Level Performance Using Bivariate Segmentation.使用双变量分割实现具有人类水平性能的自动化细胞测量门控
bioRxiv. 2024 May 9:2024.05.06.592739. doi: 10.1101/2024.05.06.592739.
用于免疫研究和人类癌症临床试验监测的质谱流式细胞术相对于流式细胞术的验证
Front Oncol. 2019 May 17;9:415. doi: 10.3389/fonc.2019.00415. eCollection 2019.
4
Predicting Cell Populations in Single Cell Mass Cytometry Data.单细胞质谱流式细胞术数据中的细胞群体预测。
Cytometry A. 2019 Jul;95(7):769-781. doi: 10.1002/cyto.a.23738. Epub 2019 Mar 12.
5
Dimensionality reduction for visualizing single-cell data using UMAP.使用UMAP进行单细胞数据可视化的降维方法。
Nat Biotechnol. 2018 Dec 3. doi: 10.1038/nbt.4314.
6
Immune Cell Dynamics Unfolded by Single-Cell Technologies.单细胞技术揭示的免疫细胞动力学
Front Immunol. 2018 Jun 26;9:1435. doi: 10.3389/fimmu.2018.01435. eCollection 2018.
7
Integrating single-cell transcriptomic data across different conditions, technologies, and species.整合不同条件、技术和物种的单细胞转录组数据。
Nat Biotechnol. 2018 Jun;36(5):411-420. doi: 10.1038/nbt.4096. Epub 2018 Apr 2.
8
Exponential scaling of single-cell RNA-seq in the past decade.单细胞 RNA-seq 在过去十年中的指数级扩展。
Nat Protoc. 2018 Apr;13(4):599-604. doi: 10.1038/nprot.2017.149. Epub 2018 Mar 1.
9
Visual analysis of mass cytometry data by hierarchical stochastic neighbour embedding reveals rare cell types.分层随机邻居嵌入的质谱细胞术数据分析的可视化揭示了稀有细胞类型。
Nat Commun. 2017 Nov 23;8(1):1740. doi: 10.1038/s41467-017-01689-9.
10
A sparse differential clustering algorithm for tracing cell type changes via single-cell RNA-sequencing data.一种稀疏差异聚类算法,用于通过单细胞 RNA 测序数据追踪细胞类型变化。
Nucleic Acids Res. 2018 Feb 16;46(3):e14. doi: 10.1093/nar/gkx1113.