• 文献检索
  • 文档翻译
  • 深度研究
  • 学术资讯
  • Suppr Zotero 插件Zotero 插件
  • 邀请有礼
  • 套餐&价格
  • 历史记录
应用&插件
Suppr Zotero 插件Zotero 插件浏览器插件Mac 客户端Windows 客户端微信小程序
定价
高级版会员购买积分包购买API积分包
服务
文献检索文档翻译深度研究API 文档MCP 服务
关于我们
关于 Suppr公司介绍联系我们用户协议隐私条款
关注我们

Suppr 超能文献

核心技术专利:CN118964589B侵权必究
粤ICP备2023148730 号-1Suppr @ 2026

文献检索

告别复杂PubMed语法,用中文像聊天一样搜索,搜遍4000万医学文献。AI智能推荐,让科研检索更轻松。

立即免费搜索

文件翻译

保留排版,准确专业,支持PDF/Word/PPT等文件格式,支持 12+语言互译。

免费翻译文档

深度研究

AI帮你快速写综述,25分钟生成高质量综述,智能提取关键信息,辅助科研写作。

立即免费体验

用于报告延迟下实时预测的新冠病毒检测阳性计数的贝叶斯插补法

Bayesian imputation of COVID-19 positive test counts for nowcasting under reporting lag.

作者信息

Jersakova Radka, Lomax James, Hetherington James, Lehmann Brieuc, Nicholson George, Briers Mark, Holmes Chris

机构信息

The Alan Turing Institute London UK.

University College London London UK.

出版信息

J R Stat Soc Ser C Appl Stat. 2022 Apr 23. doi: 10.1111/rssc.12557.

DOI:10.1111/rssc.12557
PMID:35601481
原文链接:https://pmc.ncbi.nlm.nih.gov/articles/PMC9115539/
Abstract

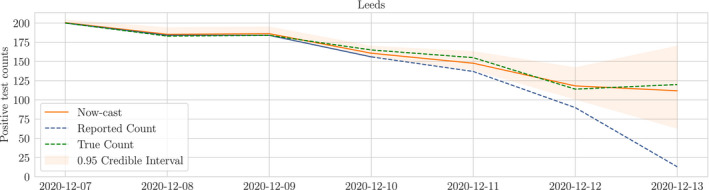
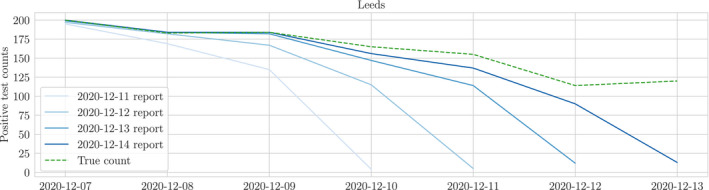
Obtaining up to date information on the number of UK COVID-19 regional infections is hampered by the reporting lag in positive test results for people with COVID-19 symptoms. In the UK, for 'Pillar 2' swab tests for those showing symptoms, it can take up to five days for results to be collated. We make use of the stability of the under reporting process over time to motivate a statistical temporal model that infers the final total count given the partial count information as it arrives. We adopt a Bayesian approach that provides for subjective priors on parameters and a hierarchical structure for an underlying latent intensity process for the infection counts. This results in a smoothed time-series representation nowcasting the expected number of daily counts of positive tests with uncertainty bands that can be used to aid decision making. Inference is performed using sequential Monte Carlo.

摘要

由于有新冠病毒症状者的阳性检测结果报告存在延迟,获取英国新冠病毒区域感染数量的最新信息受到了阻碍。在英国,对于有症状者的“第二支柱”拭子检测,结果整理可能需要长达五天的时间。我们利用漏报过程随时间的稳定性,构建了一个统计时间模型,该模型根据陆续得到的部分计数信息推断最终总数。我们采用贝叶斯方法,为参数提供主观先验,并为感染计数的潜在强度过程构建层次结构。这产生了一个平滑的时间序列表示,即现在预测每日阳性检测数的预期数量,并带有可用于辅助决策的不确定性区间。推理是使用序贯蒙特卡罗方法进行的。

https://cdn.ncbi.nlm.nih.gov/pmc/blobs/1457/9115539/fdc6aef5550d/RSSC-9999-0-g020.jpg
https://cdn.ncbi.nlm.nih.gov/pmc/blobs/1457/9115539/1f8180f83222/RSSC-9999-0-g011.jpg
https://cdn.ncbi.nlm.nih.gov/pmc/blobs/1457/9115539/931416c33f13/RSSC-9999-0-g017.jpg
https://cdn.ncbi.nlm.nih.gov/pmc/blobs/1457/9115539/87b777ed1616/RSSC-9999-0-g019.jpg
https://cdn.ncbi.nlm.nih.gov/pmc/blobs/1457/9115539/6cff727f7aa7/RSSC-9999-0-g004.jpg
https://cdn.ncbi.nlm.nih.gov/pmc/blobs/1457/9115539/92c8afc0357a/RSSC-9999-0-g008.jpg
https://cdn.ncbi.nlm.nih.gov/pmc/blobs/1457/9115539/ea040c81a8ba/RSSC-9999-0-g003.jpg
https://cdn.ncbi.nlm.nih.gov/pmc/blobs/1457/9115539/b134acd0146c/RSSC-9999-0-g021.jpg
https://cdn.ncbi.nlm.nih.gov/pmc/blobs/1457/9115539/a90f1217f331/RSSC-9999-0-g010.jpg
https://cdn.ncbi.nlm.nih.gov/pmc/blobs/1457/9115539/34bd04f60e0d/RSSC-9999-0-g014.jpg
https://cdn.ncbi.nlm.nih.gov/pmc/blobs/1457/9115539/a8ac72051739/RSSC-9999-0-g009.jpg
https://cdn.ncbi.nlm.nih.gov/pmc/blobs/1457/9115539/d6a0188143ac/RSSC-9999-0-g005.jpg
https://cdn.ncbi.nlm.nih.gov/pmc/blobs/1457/9115539/5bded8a7f4ce/RSSC-9999-0-g001.jpg
https://cdn.ncbi.nlm.nih.gov/pmc/blobs/1457/9115539/abbb352ac8f0/RSSC-9999-0-g002.jpg
https://cdn.ncbi.nlm.nih.gov/pmc/blobs/1457/9115539/3de4ae1c7910/RSSC-9999-0-g012.jpg
https://cdn.ncbi.nlm.nih.gov/pmc/blobs/1457/9115539/f8712b605e2a/RSSC-9999-0-g013.jpg
https://cdn.ncbi.nlm.nih.gov/pmc/blobs/1457/9115539/0636da137e79/RSSC-9999-0-g018.jpg
https://cdn.ncbi.nlm.nih.gov/pmc/blobs/1457/9115539/cccf9ec1c7a6/RSSC-9999-0-g016.jpg
https://cdn.ncbi.nlm.nih.gov/pmc/blobs/1457/9115539/12f893234999/RSSC-9999-0-g006.jpg
https://cdn.ncbi.nlm.nih.gov/pmc/blobs/1457/9115539/8b25e941b5fc/RSSC-9999-0-g007.jpg
https://cdn.ncbi.nlm.nih.gov/pmc/blobs/1457/9115539/fdc6aef5550d/RSSC-9999-0-g020.jpg

相似文献

1
Bayesian imputation of COVID-19 positive test counts for nowcasting under reporting lag.用于报告延迟下实时预测的新冠病毒检测阳性计数的贝叶斯插补法
J R Stat Soc Ser C Appl Stat. 2022 Apr 23. doi: 10.1111/rssc.12557.
2
A machine learning model for nowcasting epidemic incidence.用于实时预测疫情发病率的机器学习模型。
Math Biosci. 2022 Jan;343:108677. doi: 10.1016/j.mbs.2021.108677. Epub 2021 Nov 27.
3
Nowcasting for Real-Time COVID-19 Tracking in New York City: An Evaluation Using Reportable Disease Data From Early in the Pandemic.实时追踪纽约市 COVID-19:利用大流行早期报告性疾病数据进行评估
JMIR Public Health Surveill. 2021 Jan 15;7(1):e25538. doi: 10.2196/25538.
4
A Bayesian Spatiotemporal Nowcasting Model for Public Health Decision-Making and Surveillance.用于公共卫生决策和监测的贝叶斯时空临近预报模型。
Am J Epidemiol. 2022 May 20;191(6):1107-1115. doi: 10.1093/aje/kwac034.
5
Nowcasting the COVID-19 pandemic in Bavaria.实时预测巴伐利亚州的 COVID-19 疫情。
Biom J. 2021 Mar;63(3):490-502. doi: 10.1002/bimj.202000112. Epub 2020 Dec 1.
6
[Meta-analysis of the Italian studies on short-term effects of air pollution].[意大利关于空气污染短期影响研究的荟萃分析]
Epidemiol Prev. 2001 Mar-Apr;25(2 Suppl):1-71.
7
Real-Time Epidemiology and Acute Care Need Monitoring and Forecasting for COVID-19 via Bayesian Sequential Monte Carlo-Leveraged Transmission Models.基于贝叶斯序贯蒙特卡罗-传播模型的 COVID-19 实时流行病学与急性医疗需求监测和预测。
Int J Environ Res Public Health. 2024 Feb 7;21(2):193. doi: 10.3390/ijerph21020193.
8
Improving Bayesian radiological profiling of waste drums using Dirichlet priors, Gaussian process priors, and hierarchical modeling.利用狄利克雷先验分布、高斯过程先验分布和层次模型提高废物桶的贝叶斯放射性剖析。
Appl Radiat Isot. 2023 Apr;194:110691. doi: 10.1016/j.apradiso.2023.110691. Epub 2023 Jan 24.
9
Nowcasting COVID-19 Statistics Reported with Delay: A Case-Study of Sweden and the UK.即时播报 COVID-19 延迟报告统计:瑞典和英国的案例研究。
Int J Environ Res Public Health. 2023 Feb 9;20(4):3040. doi: 10.3390/ijerph20043040.
10
Delay in death reporting affects timely monitoring and modeling of the COVID-19 pandemic.死亡报告的延迟影响了对 COVID-19 大流行的及时监测和建模。
Cad Saude Publica. 2021 Aug 13;37(7):e00292320. doi: 10.1590/0102-311X00292320. eCollection 2021.

引用本文的文献

1
Nowcasting methods to improve the performance of respiratory sentinel surveillance: lessons from the COVID-19 pandemic.实时预测方法提高呼吸道传染病哨点监测的性能:从 COVID-19 大流行中获得的经验教训。
Sci Rep. 2024 May 31;14(1):12582. doi: 10.1038/s41598-024-62965-5.
2
Collaborative nowcasting of COVID-19 hospitalization incidences in Germany.德国 COVID-19 住院病例的协同实时预测。
PLoS Comput Biol. 2023 Aug 11;19(8):e1011394. doi: 10.1371/journal.pcbi.1011394. eCollection 2023 Aug.
3
Nowcasting COVID-19 deaths in England by age and region.

本文引用的文献

1
Stan: A Probabilistic Programming Language.斯坦:一种概率编程语言。
J Stat Softw. 2017;76. doi: 10.18637/jss.v076.i01. Epub 2017 Jan 11.
2
Nowcasting COVID-19 deaths in England by age and region.按年龄和地区对英格兰的新冠肺炎死亡病例进行即时预测。
J R Stat Soc Ser C Appl Stat. 2022 Jun 15. doi: 10.1111/rssc.12576.
3
Improving local prevalence estimates of SARS-CoV-2 infections using a causal debiasing framework.利用因果去偏框架提高 SARS-CoV-2 感染的本地流行率估计。
按年龄和地区对英格兰的新冠肺炎死亡病例进行即时预测。
J R Stat Soc Ser C Appl Stat. 2022 Jun 15. doi: 10.1111/rssc.12576.
4
Improving local prevalence estimates of SARS-CoV-2 infections using a causal debiasing framework.利用因果去偏框架提高 SARS-CoV-2 感染的本地流行率估计。
Nat Microbiol. 2022 Jan;7(1):97-107. doi: 10.1038/s41564-021-01029-0. Epub 2021 Dec 31.
4
Nowcasting the COVID-19 pandemic in Bavaria.实时预测巴伐利亚州的 COVID-19 疫情。
Biom J. 2021 Mar;63(3):490-502. doi: 10.1002/bimj.202000112. Epub 2020 Dec 1.
5
Nowcasting fatal COVID-19 infections on a regional level in Germany.德国区域层面上对致命性 COVID-19 感染的实时预测。
Biom J. 2021 Mar;63(3):471-489. doi: 10.1002/bimj.202000143. Epub 2020 Nov 20.
6
Nowcasting by Bayesian Smoothing: A flexible, generalizable model for real-time epidemic tracking.贝叶斯平滑的实时预测:一种用于实时传染病追踪的灵活、可推广的模型。
PLoS Comput Biol. 2020 Apr 6;16(4):e1007735. doi: 10.1371/journal.pcbi.1007735. eCollection 2020 Apr.
7
Multivariate hierarchical frameworks for modeling delayed reporting in count data.用于对计数数据中延迟报告进行建模的多元层次框架。
Biometrics. 2020 Sep;76(3):789-798. doi: 10.1111/biom.13188. Epub 2019 Nov 29.
8
Bayesian hierarchical spatial models: Implementing the Besag York Mollié model in stan.贝叶斯分层空间模型:在斯坦语言中实现贝萨格-约克-莫利模型
Spat Spatiotemporal Epidemiol. 2019 Nov;31:100301. doi: 10.1016/j.sste.2019.100301. Epub 2019 Aug 12.