• 文献检索
  • 文档翻译
  • 深度研究
  • 学术资讯
  • Suppr Zotero 插件Zotero 插件
  • 邀请有礼
  • 套餐&价格
  • 历史记录
应用&插件
Suppr Zotero 插件Zotero 插件浏览器插件Mac 客户端Windows 客户端微信小程序
定价
高级版会员购买积分包购买API积分包
服务
文献检索文档翻译深度研究API 文档MCP 服务
关于我们
关于 Suppr公司介绍联系我们用户协议隐私条款
关注我们

Suppr 超能文献

核心技术专利:CN118964589B侵权必究
粤ICP备2023148730 号-1Suppr @ 2026

文献检索

告别复杂PubMed语法,用中文像聊天一样搜索,搜遍4000万医学文献。AI智能推荐,让科研检索更轻松。

立即免费搜索

文件翻译

保留排版,准确专业,支持PDF/Word/PPT等文件格式,支持 12+语言互译。

免费翻译文档

深度研究

AI帮你快速写综述,25分钟生成高质量综述,智能提取关键信息,辅助科研写作。

立即免费体验

利用地球静止卫星表征非洲植被覆盖对水分限制的响应

Characterizing the Response of Vegetation Cover to Water Limitation in Africa Using Geostationary Satellites.

作者信息

Küçük Çağlar, Koirala Sujan, Carvalhais Nuno, Miralles Diego G, Reichstein Markus, Jung Martin

机构信息

Department of Biogeochemical Integration Max Planck Institute for Biogeochemistry Jena Germany.

Hydro-Climate Extremes Lab (H-CEL) Faculty of Bioscience Engineering Ghent University Ghent Belgium.

出版信息

J Adv Model Earth Syst. 2022 Mar;14(3):e2021MS002730. doi: 10.1029/2021MS002730. Epub 2022 Feb 28.

DOI:10.1029/2021MS002730
PMID:35865621
原文链接:https://pmc.ncbi.nlm.nih.gov/articles/PMC9286687/
Abstract

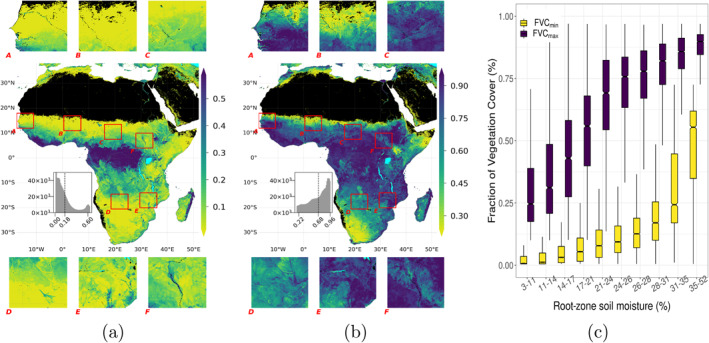
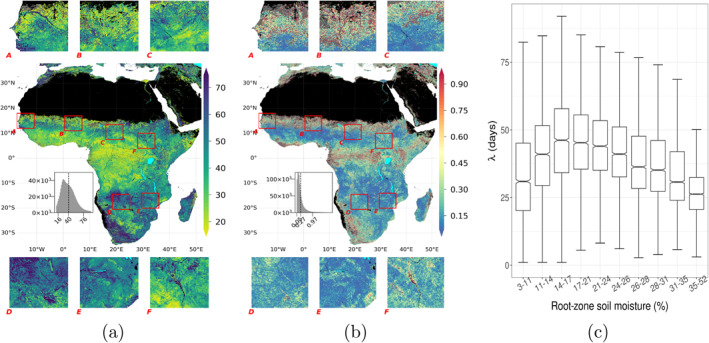
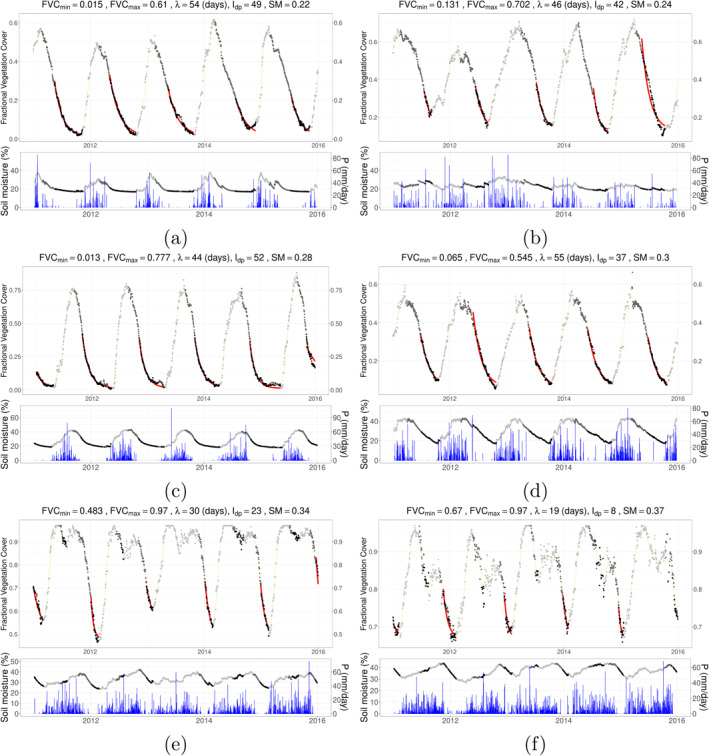
Hydrological interactions between vegetation, soil, and topography are complex, and heterogeneous in semi-arid landscapes. This along with data scarcity poses challenges for large-scale modeling of vegetation-water interactions. Here, we exploit metrics derived from daily Meteosat data over Africa at ca. 5 km spatial resolution for ecohydrological analysis. Their spatial patterns are based on Fractional Vegetation Cover (FVC) time series and emphasize limiting conditions of the seasonal wet to dry transition: the minimum and maximum FVC of temporal record, the FVC decay rate and the FVC integral over the decay period. We investigate the relevance of these metrics for large scale ecohydrological studies by assessing their co-variation with soil moisture, and with topographic, soil, and vegetation factors. Consistent with our initial hypothesis, FVC minimum and maximum increase with soil moisture, while the FVC integral and decay rate peak at intermediate soil moisture. We find evidence for the relevance of topographic moisture variations in arid regions, which, counter-intuitively, is detectable in the maximum but not in the minimum FVC. We find no clear evidence for wide-spread occurrence of the "inverse texture effect" on FVC. The FVC integral over the decay period correlates with independent data sets of plant water storage capacity or rooting depth while correlations increase with aridity. In arid regions, the FVC decay rate decreases with canopy height and tree cover fraction as expected for ecosystems with a more conservative water-use strategy. Thus, our observation-based products have large potential for better understanding complex vegetation-water interactions from regional to continental scales.

摘要

植被、土壤和地形之间的水文相互作用复杂,且在半干旱地区呈非均一性。这一情况以及数据稀缺给植被 - 水相互作用的大规模建模带来了挑战。在此,我们利用从非洲约5公里空间分辨率的每日气象卫星数据中得出的指标进行生态水文分析。它们的空间格局基于植被覆盖分数(FVC)时间序列,并强调了从季节性湿润到干燥过渡的限制条件:时间记录中的FVC最小值和最大值、FVC衰减率以及衰减期内的FVC积分。我们通过评估这些指标与土壤湿度以及地形、土壤和植被因子的协变关系,来研究它们在大规模生态水文研究中的相关性。与我们最初的假设一致,FVC最小值和最大值随土壤湿度增加,而FVC积分和衰减率在中等土壤湿度时达到峰值。我们发现干旱地区地形湿度变化具有相关性的证据,这与直觉相反,在FVC最大值中可检测到,而在最小值中未检测到。我们没有找到关于FVC广泛存在“反质地效应”的明确证据。衰减期内的FVC积分与植物储水能力或生根深度的独立数据集相关,且相关性随干旱程度增加。在干旱地区,正如具有更保守用水策略的生态系统所预期的那样,FVC衰减率随冠层高度和树木覆盖分数降低。因此,我们基于观测的产品在更好地理解从区域到大陆尺度的复杂植被 - 水相互作用方面具有巨大潜力。

https://cdn.ncbi.nlm.nih.gov/pmc/blobs/57ea/9286687/c5fcc0ea1168/JAME-14-0-g008.jpg
https://cdn.ncbi.nlm.nih.gov/pmc/blobs/57ea/9286687/08d9a3fcc0bb/JAME-14-0-g003.jpg
https://cdn.ncbi.nlm.nih.gov/pmc/blobs/57ea/9286687/c45e836513ca/JAME-14-0-g009.jpg
https://cdn.ncbi.nlm.nih.gov/pmc/blobs/57ea/9286687/7d8f2dabce70/JAME-14-0-g007.jpg
https://cdn.ncbi.nlm.nih.gov/pmc/blobs/57ea/9286687/5a51917573f1/JAME-14-0-g016.jpg
https://cdn.ncbi.nlm.nih.gov/pmc/blobs/57ea/9286687/8e0506bc8ab5/JAME-14-0-g014.jpg
https://cdn.ncbi.nlm.nih.gov/pmc/blobs/57ea/9286687/2f81724a3c76/JAME-14-0-g011.jpg
https://cdn.ncbi.nlm.nih.gov/pmc/blobs/57ea/9286687/5eb1a1a09823/JAME-14-0-g013.jpg
https://cdn.ncbi.nlm.nih.gov/pmc/blobs/57ea/9286687/293fa937d95e/JAME-14-0-g005.jpg
https://cdn.ncbi.nlm.nih.gov/pmc/blobs/57ea/9286687/649f7afbdb39/JAME-14-0-g002.jpg
https://cdn.ncbi.nlm.nih.gov/pmc/blobs/57ea/9286687/1179738cd89d/JAME-14-0-g015.jpg
https://cdn.ncbi.nlm.nih.gov/pmc/blobs/57ea/9286687/485307815528/JAME-14-0-g017.jpg
https://cdn.ncbi.nlm.nih.gov/pmc/blobs/57ea/9286687/a4967ce260a1/JAME-14-0-g012.jpg
https://cdn.ncbi.nlm.nih.gov/pmc/blobs/57ea/9286687/f0c07e647a5d/JAME-14-0-g010.jpg
https://cdn.ncbi.nlm.nih.gov/pmc/blobs/57ea/9286687/360a62344bd0/JAME-14-0-g004.jpg
https://cdn.ncbi.nlm.nih.gov/pmc/blobs/57ea/9286687/2caa705a3a84/JAME-14-0-g001.jpg
https://cdn.ncbi.nlm.nih.gov/pmc/blobs/57ea/9286687/c9410e5d4134/JAME-14-0-g006.jpg
https://cdn.ncbi.nlm.nih.gov/pmc/blobs/57ea/9286687/c5fcc0ea1168/JAME-14-0-g008.jpg

相似文献

1
Characterizing the Response of Vegetation Cover to Water Limitation in Africa Using Geostationary Satellites.利用地球静止卫星表征非洲植被覆盖对水分限制的响应
J Adv Model Earth Syst. 2022 Mar;14(3):e2021MS002730. doi: 10.1029/2021MS002730. Epub 2022 Feb 28.
2
Observation-based assessment of secondary water effects on seasonal vegetation decay across Africa.基于观测对非洲地区二次水效应影响季节性植被衰退的评估。
Front Big Data. 2022 Sep 9;5:967477. doi: 10.3389/fdata.2022.967477. eCollection 2022.
3
Hybrid inversion of radiative transfer models based on high spatial resolution satellite reflectance data improves fractional vegetation cover retrieval in heterogeneous ecological systems after fire.基于高空间分辨率卫星反射率数据的辐射传输模型混合反演改进了火灾后异质生态系统中植被覆盖度分数的反演。
Remote Sens Environ. 2021 Jan 22;255. doi: 10.1016/j.rse.2021.112304. eCollection 2021 Mar 15.
4
A novel ecohydrological model by capturing variations in climate change and vegetation coverage in a semi-arid region of China.一种新的生态水文学模型,通过捕捉中国半干旱地区气候变化和植被覆盖变化。
Environ Res. 2022 Aug;211:113085. doi: 10.1016/j.envres.2022.113085. Epub 2022 Mar 18.
5
Spatiotemporal evolution and driving factors analysis of fractional vegetation coverage in the arid region of northwest China.中国西北干旱区植被覆盖度时空演变及驱动因素分析
Sci Total Environ. 2024 Dec 1;954:176271. doi: 10.1016/j.scitotenv.2024.176271. Epub 2024 Sep 13.
6
[Variation in fractional vegetation cover and its attribution analysis of different regions of Beijing-Tianjin Sand Source Region, China].[中国京津风沙源区不同区域植被覆盖度变化及其归因分析]
Ying Yong Sheng Tai Xue Bao. 2021 Aug;32(8):2895-2905. doi: 10.13287/j.1001-9332.202108.018.
7
Unlocking the ecohydrological dynamics of vegetation growth's impact on Terrestrial Water Storage trends across the China-Pakistan Economic Corridor.揭示植被生长对中国-巴基斯坦经济走廊沿线陆地水储量变化趋势的生态水文学动态。
Sci Total Environ. 2024 Dec 10;955:176977. doi: 10.1016/j.scitotenv.2024.176977. Epub 2024 Oct 18.
8
Soil moisture change analysis under watershed management practice using in situ and remote sensing data in a paired watershed.基于原位和遥感数据的流域管理实践下的土壤湿度变化分析:一个成对流域案例。
Environ Monit Assess. 2021 Apr 24;193(5):299. doi: 10.1007/s10661-021-09078-y.
9
[Fractional vegetation cover and topographic effects in Pisha sandstone area of Northwest China in 2000-2018].2000 - 2018年中国西北砒砂岩地区植被覆盖度及地形效应
Ying Yong Sheng Tai Xue Bao. 2020 Apr;31(4):1194-1202. doi: 10.13287/j.1001-9332.202004.005.
10
Plant traits in influencing soil moisture in semiarid grasslands of the Loess Plateau, China.在中国黄土高原半干旱草地中,植物特征对土壤湿度的影响。
Sci Total Environ. 2020 May 20;718:137355. doi: 10.1016/j.scitotenv.2020.137355. Epub 2020 Feb 15.

引用本文的文献

1
Observation-based assessment of secondary water effects on seasonal vegetation decay across Africa.基于观测对非洲地区二次水效应影响季节性植被衰退的评估。
Front Big Data. 2022 Sep 9;5:967477. doi: 10.3389/fdata.2022.967477. eCollection 2022.

本文引用的文献

1
Annual precipitation explains variability in dryland vegetation greenness globally but not locally.年降水量解释了全球旱地植被绿度的变异性,但无法解释局部地区的变异性。
Glob Chang Biol. 2021 Sep;27(18):4367-4380. doi: 10.1111/gcb.15729. Epub 2021 Jun 22.
2
Complex spatiotemporal phenological shifts as a response to rainfall changes.作为对降雨变化响应的复杂时空物候变化。
New Phytol. 2004 Mar;161(3):837-846. doi: 10.1111/j.1469-8137.2004.01003.x. Epub 2004 Jan 14.
3
Large uncertainties in future biome changes in Africa call for flexible climate adaptation strategies.
未来非洲生物群落变化的巨大不确定性要求采取灵活的气候适应策略。
Glob Chang Biol. 2021 Jan;27(2):340-358. doi: 10.1111/gcb.15390. Epub 2020 Nov 4.
4
Ecosystem transpiration and evaporation: Insights from three water flux partitioning methods across FLUXNET sites.生态系统蒸散和蒸发:三种通量分割方法在通量网站点的应用见解。
Glob Chang Biol. 2020 Dec;26(12):6916-6930. doi: 10.1111/gcb.15314. Epub 2020 Oct 6.
5
Geomorpho90m, empirical evaluation and accuracy assessment of global high-resolution geomorphometric layers.全球高分辨率地貌计量层的地貌 90m,经验评估和精度评估。
Sci Data. 2020 May 28;7(1):162. doi: 10.1038/s41597-020-0479-6.
6
Rainfall manipulation experiments as simulated by terrestrial biosphere models: Where do we stand?陆地生物圈模型模拟的降雨操纵实验:我们处于什么位置?
Glob Chang Biol. 2020 Jun;26(6):3336-3355. doi: 10.1111/gcb.15024. Epub 2020 Mar 18.
7
Photoperiod controls vegetation phenology across Africa.光周期控制着整个非洲的植被物候。
Commun Biol. 2019 Oct 25;2:391. doi: 10.1038/s42003-019-0636-7. eCollection 2019.
8
Net carbon emissions from African biosphere dominate pan-tropical atmospheric CO signal.非洲生物圈的净碳排放量主导着泛热带大气 CO 信号。
Nat Commun. 2019 Aug 13;10(1):3344. doi: 10.1038/s41467-019-11097-w.
9
Ecosystem structural changes controlled by altered rainfall climatology in tropical savannas.降雨气候改变对热带草原生态系统结构变化的控制作用。
Nat Commun. 2019 Feb 8;10(1):671. doi: 10.1038/s41467-019-08602-6.
10
Forecasting dryland vegetation condition months in advance through satellite data assimilation.利用卫星数据同化技术提前数月预测旱地植被状况。
Nat Commun. 2019 Jan 28;10(1):469. doi: 10.1038/s41467-019-08403-x.